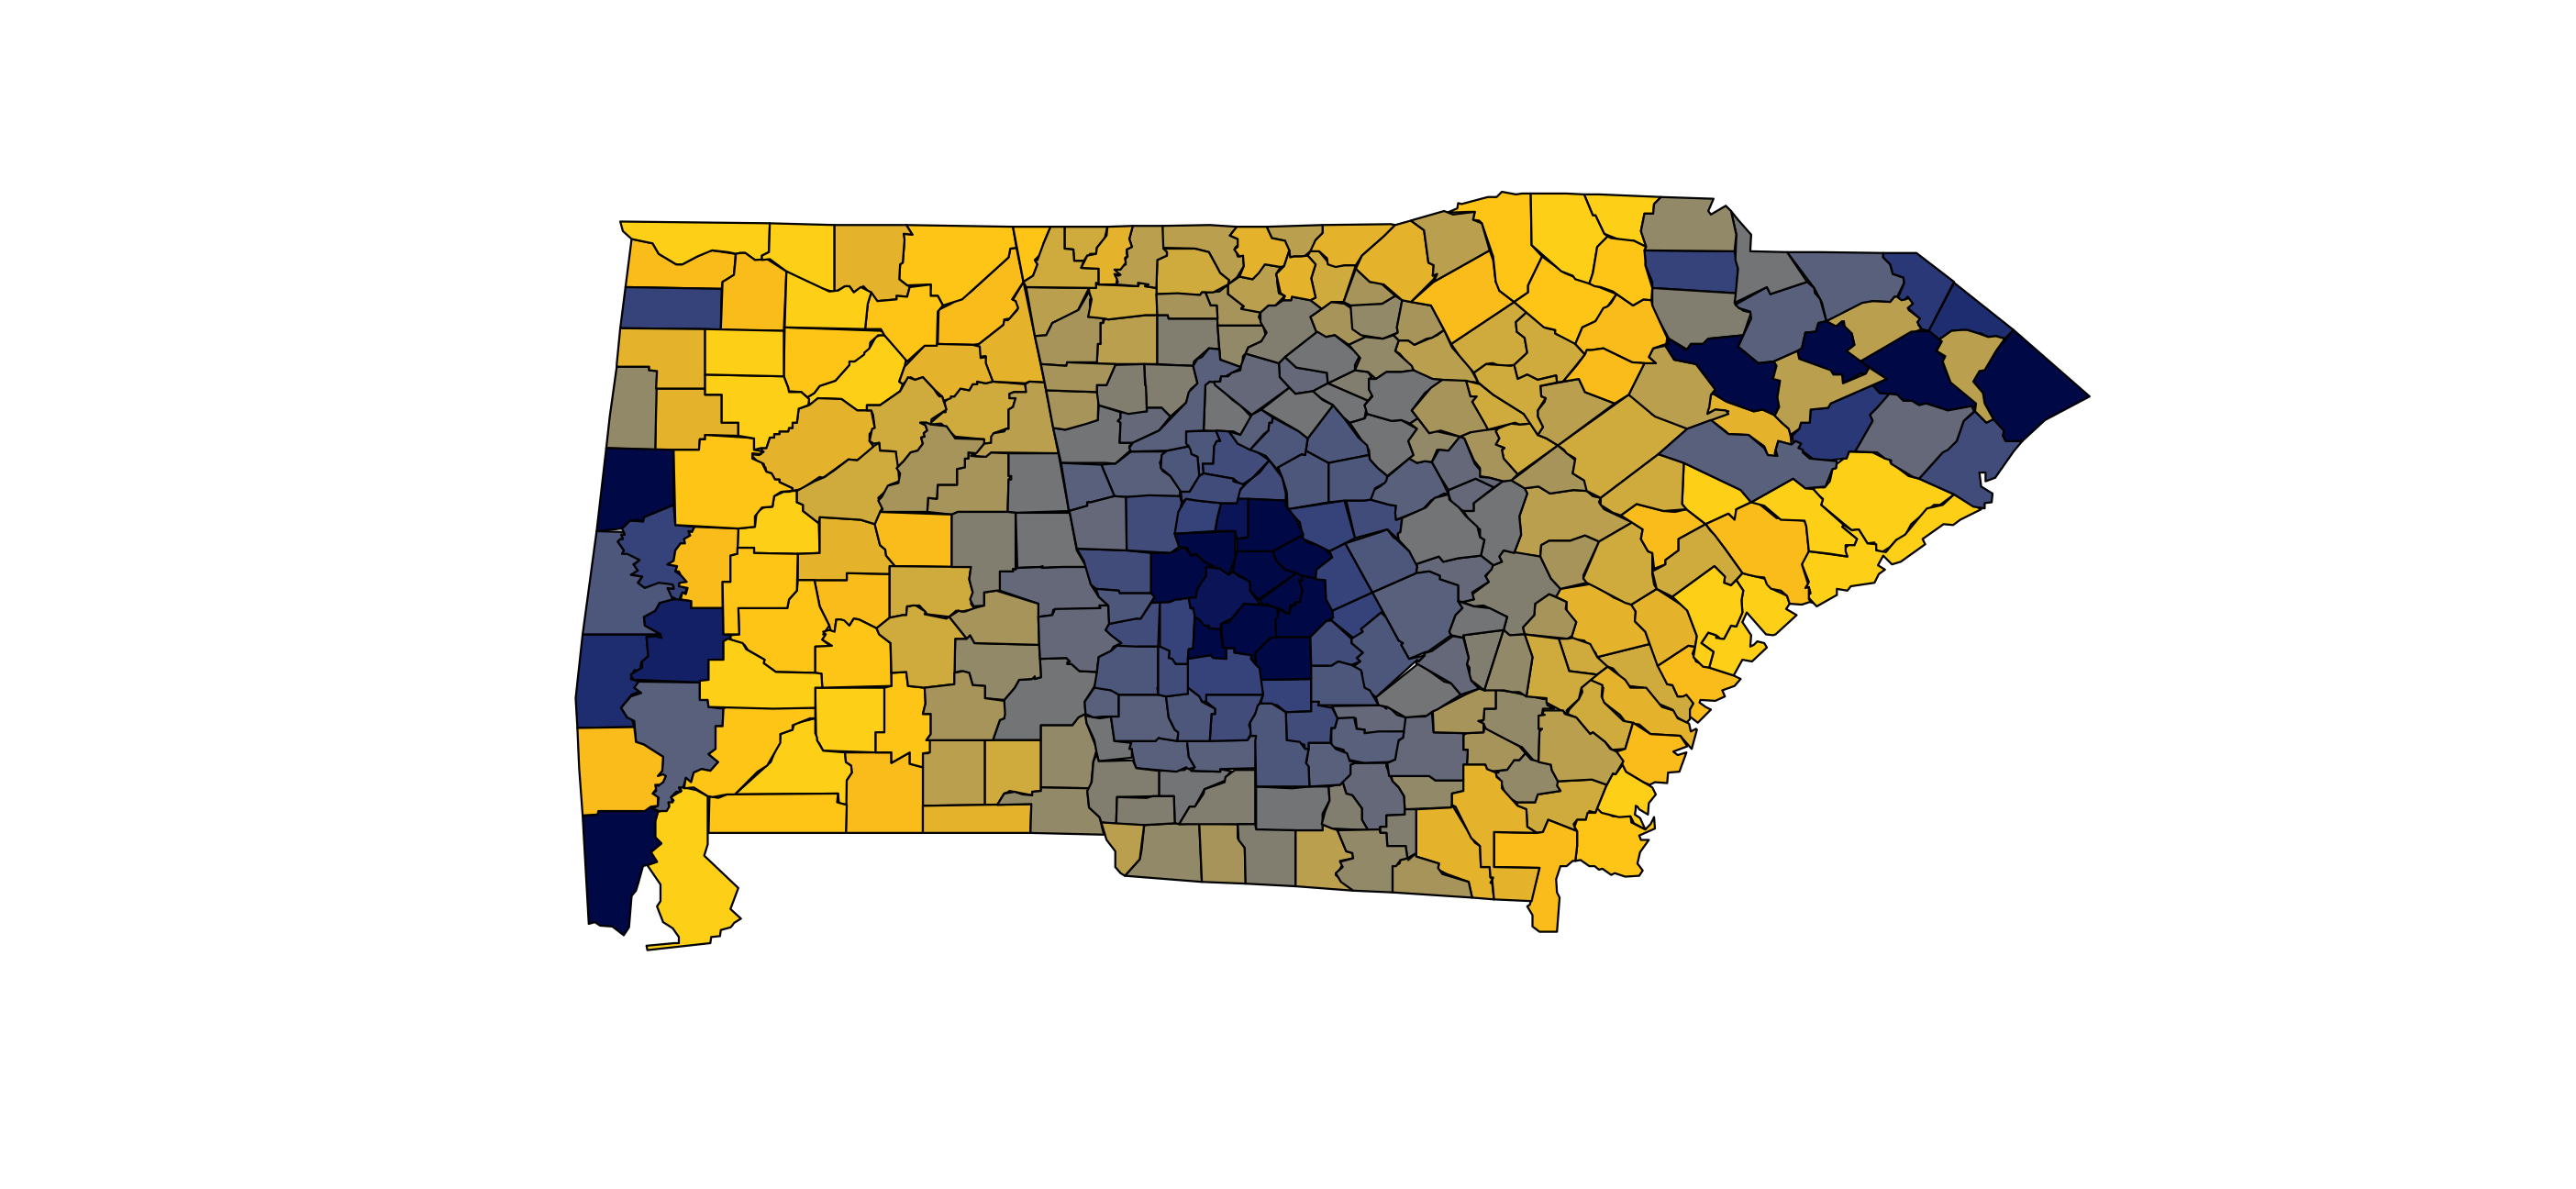
The use of colour in graphics
A journey through the body & mind to the screen
Nicholas Tierney, Monash University
Monash Data Fluency, June 26
bit.ly/njt-monash-colour
nj_tierney
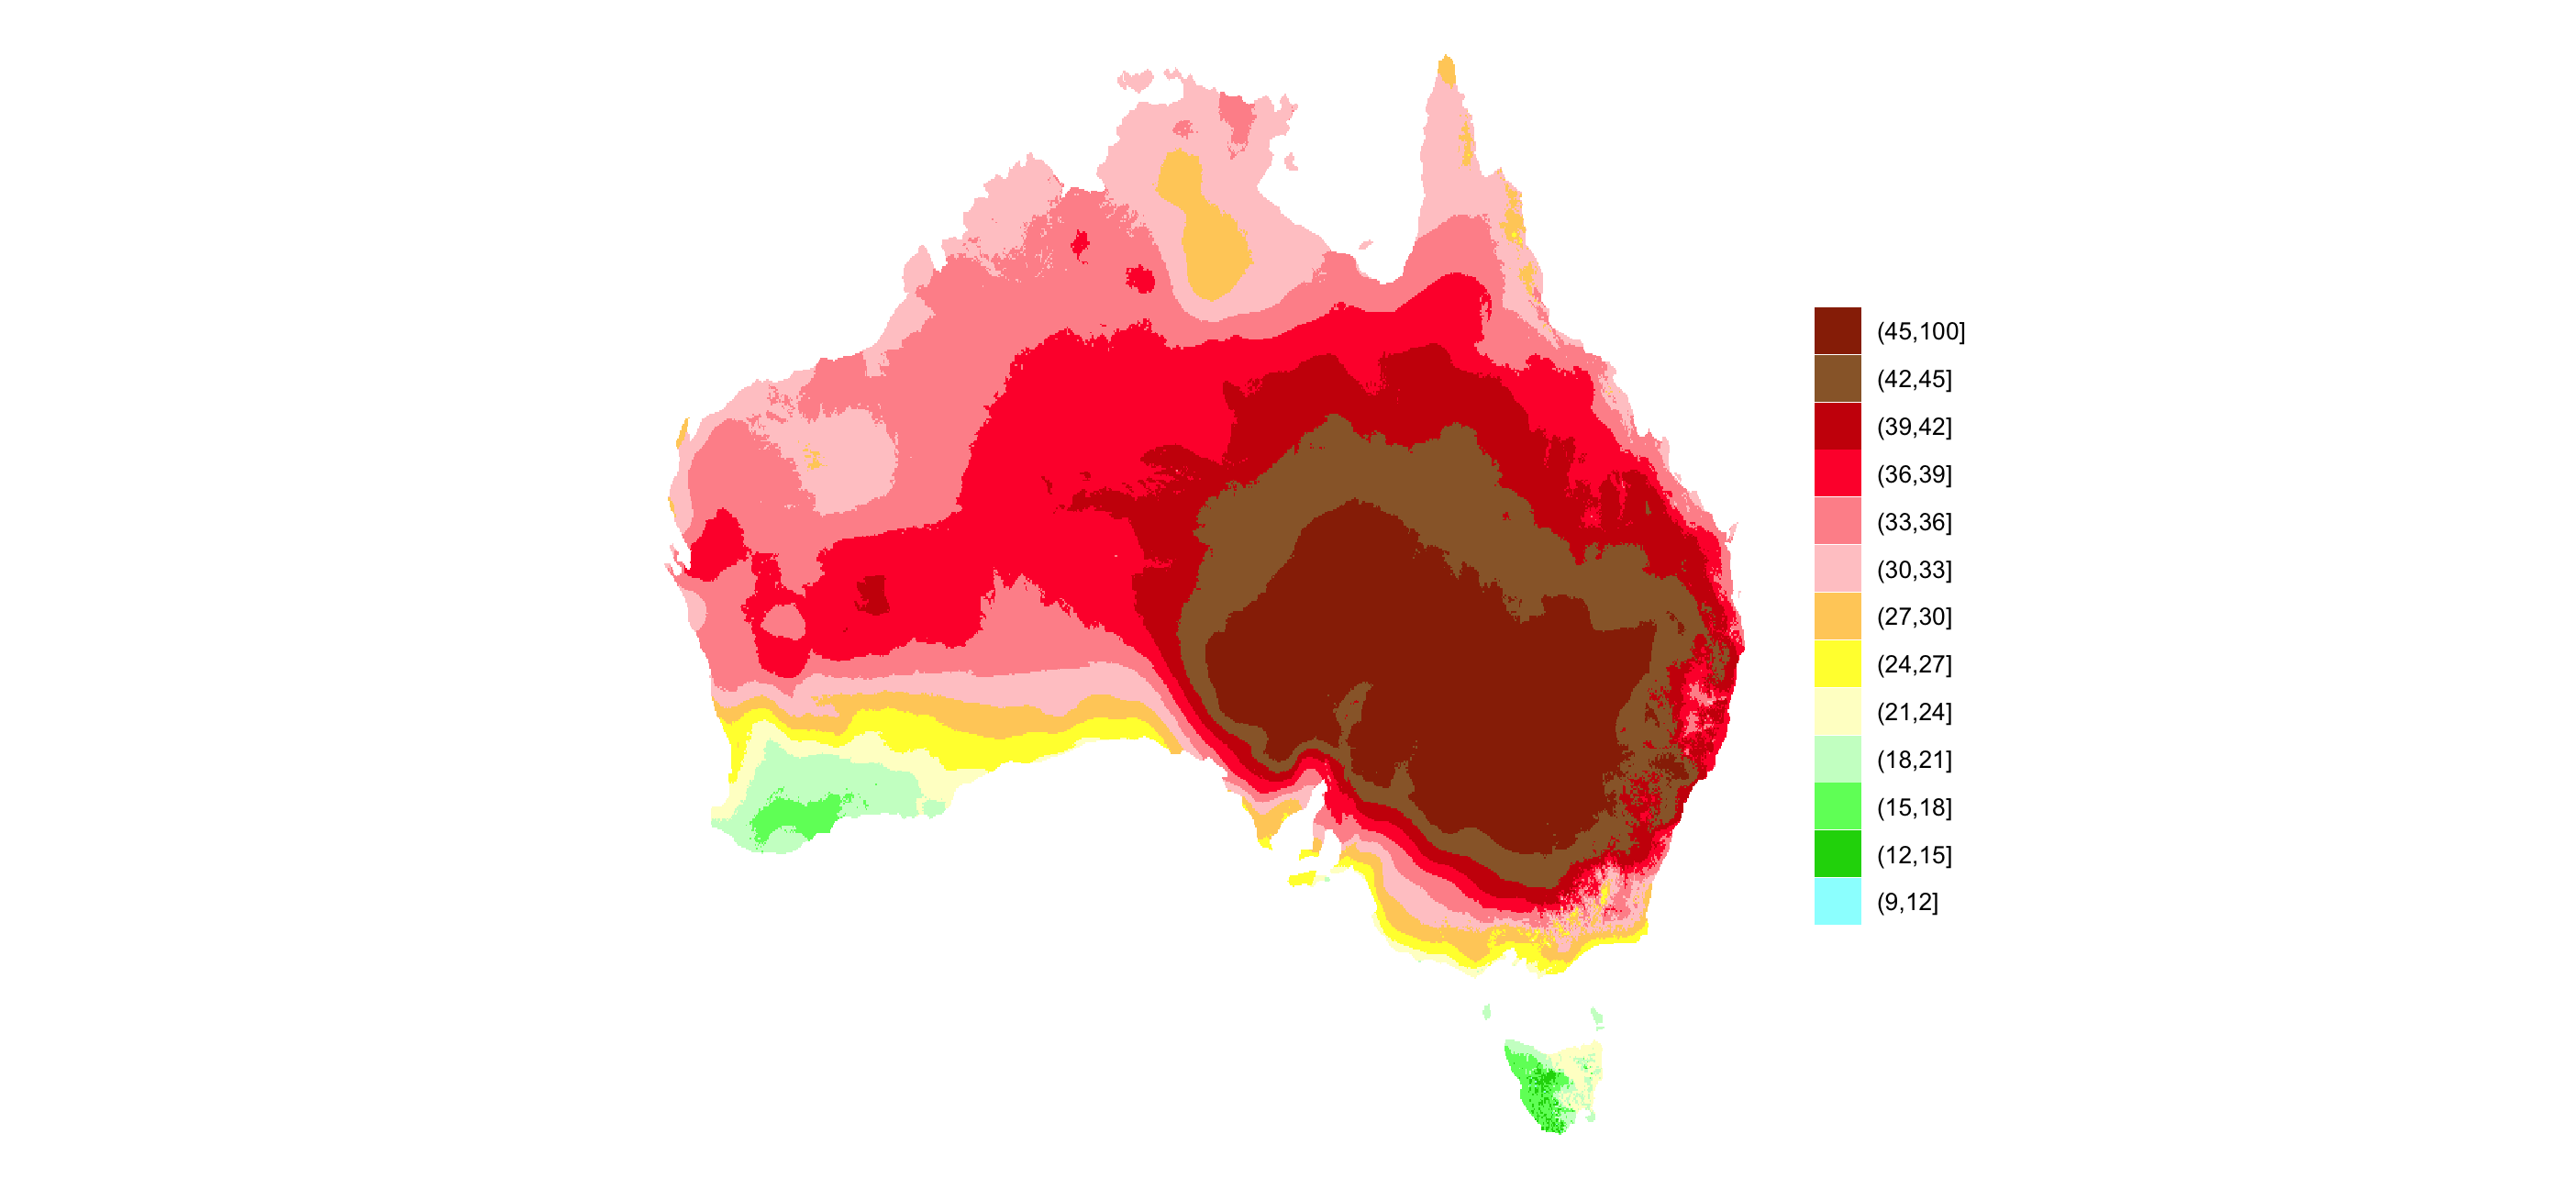
Your turn: What makes this graphic good, and bad?

BoM 😢
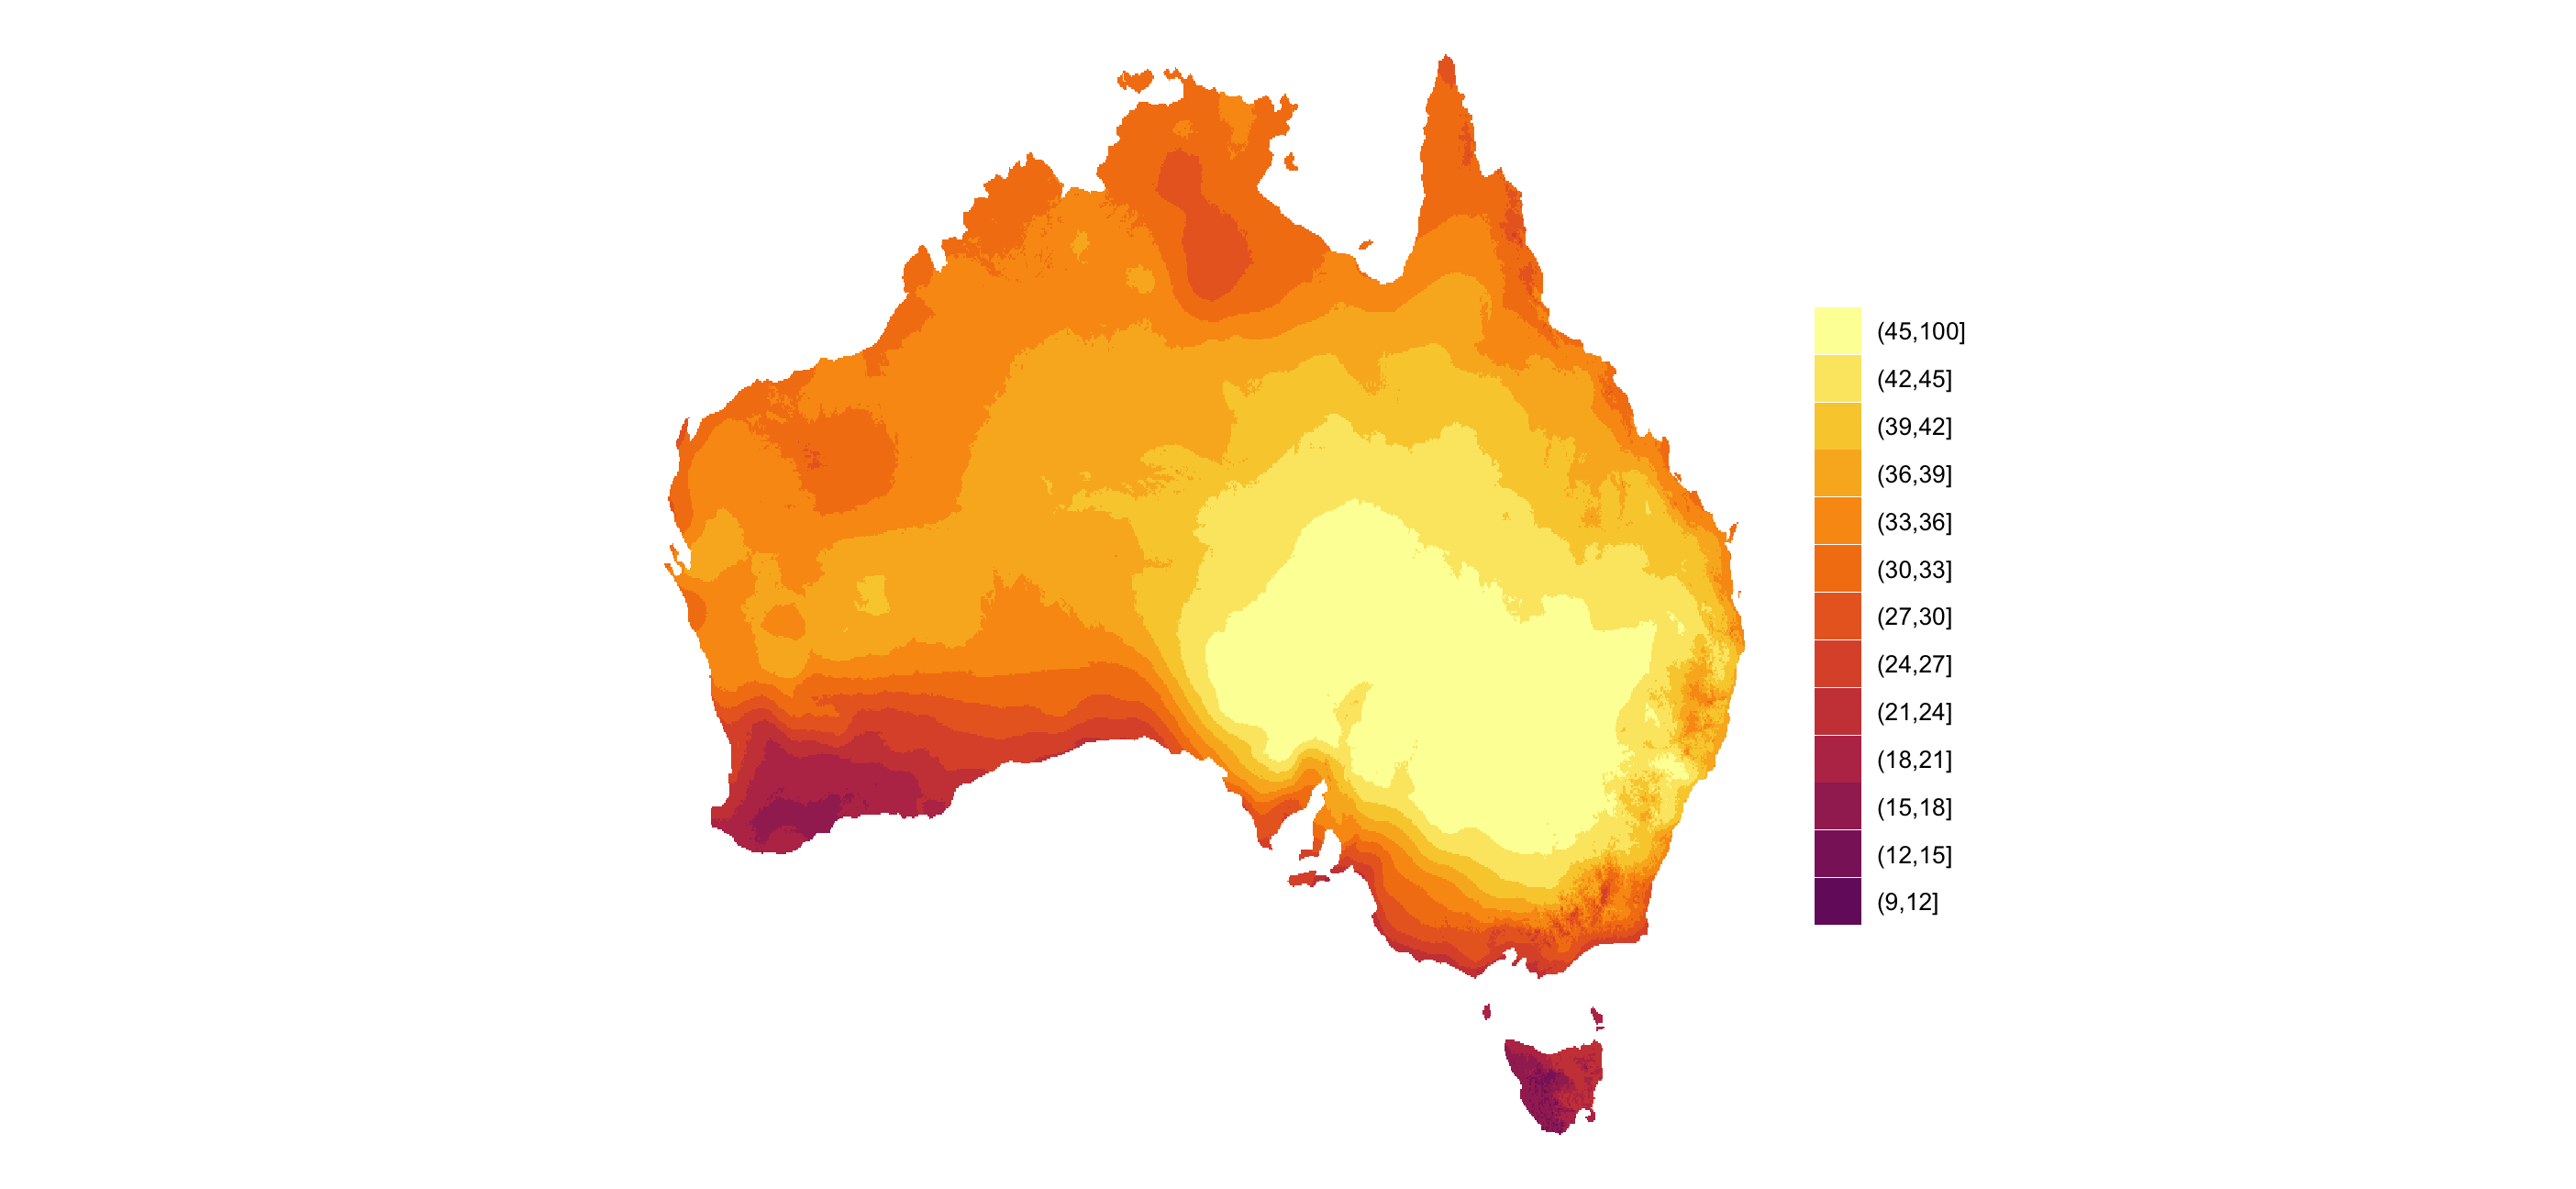
Viridis 😄
Jet?
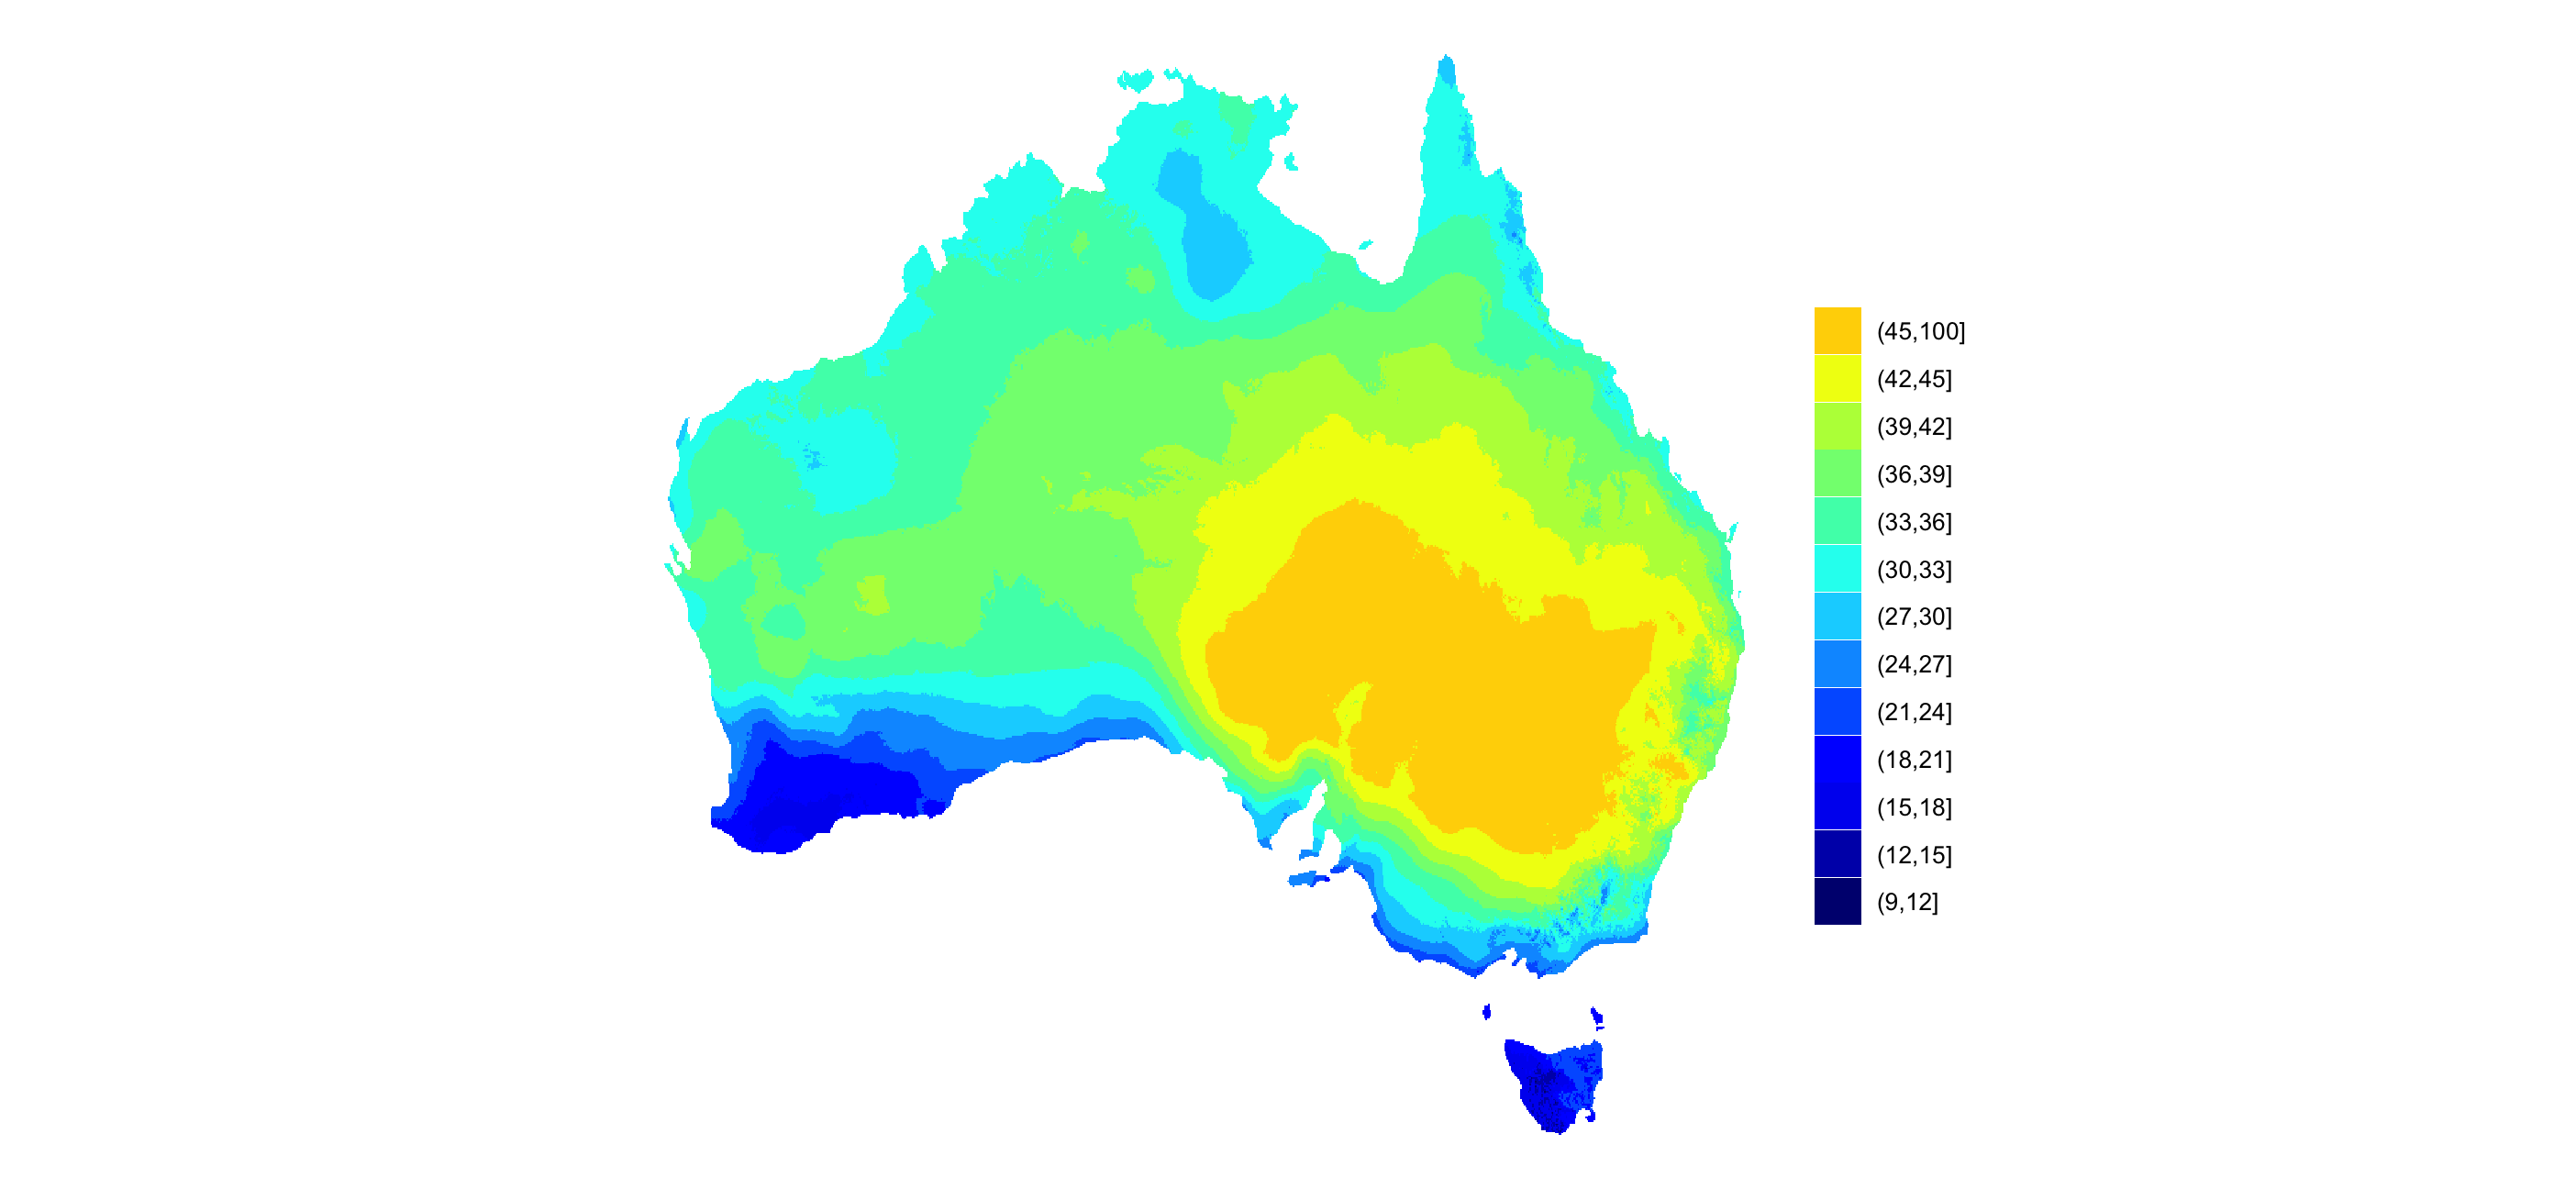
Sometimes the conversation ends there, and you provide them a few graphics that look better. Like this.
How do we describe what is better/worse about them?
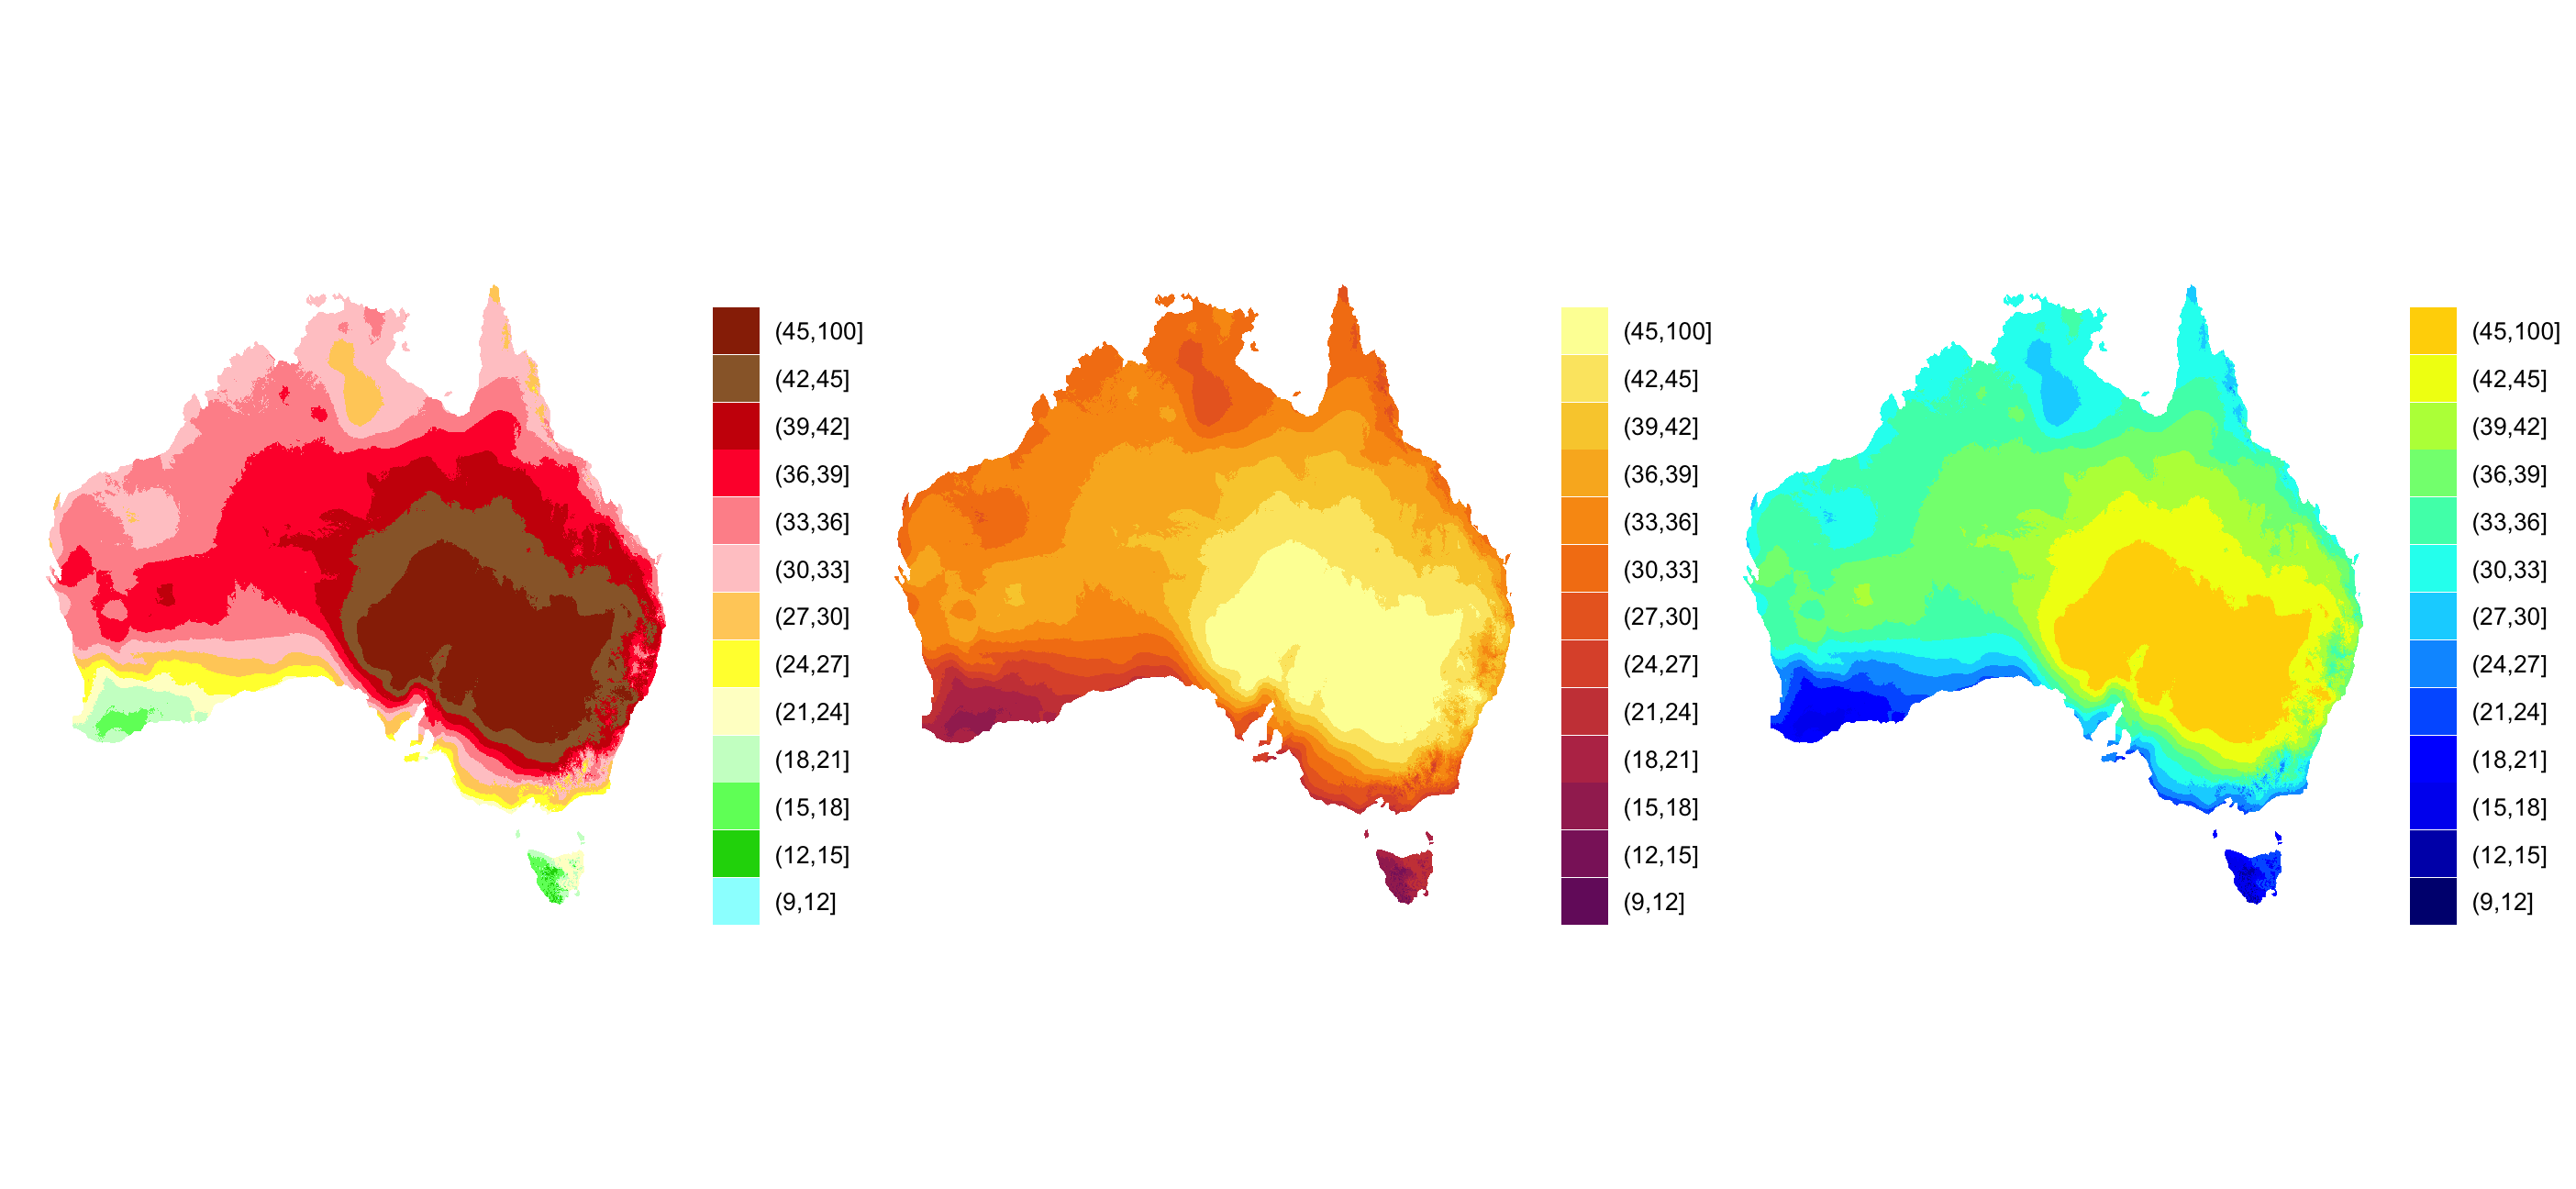
Describing why and how one is better

- Vocabulary to describe why
- Not just: "It's not colourblind safe", "The colours are wrong" "Type of colourscale is wrong".
- I want to explain the other perceptual properties
I guess the other parts of my motivation for this talk come from seeing a lot of people using bad/sub optimal colourscales.
There is great tooling in R to do the following:
We're going in for a deep dive here, folks

Goals of this talk
- What is colour?
- How do we perceive colour?
- What is colourblindness?
- What is a vocabulary around colour?
- How do I use colour in my plot?
- How do I assess colour?
- How do I create new colour palettes?
This made sense to me, I know what colourblindness is, and I know what perceptually uniform means.
But I also have an honours degree in Psychological Science. My honours project studied the human visual system, in an area called psychophysics. I didn’t study colour, but we did need to learn about the visual system in neuropsychology.
What is colour?
Goals of this talk
- What is colour?
- How do we perceive colour?
- What is colourblindness?
- What is a vocabulary around colour?
- How do I use colour in my plot?
- How do I assess colour?
- How do I create new colour palettes?
This next section is inspired by Calder Hansen's The Science of Color Perception
This made sense to me, I know what colourblindness is, and I know what perceptually uniform means.
But I also have an honours degree in Psychological Science. My honours project studied the human visual system, in an area called psychophysics. I didn’t study colour, but we did need to learn about the visual system in neuropsychology.
What is colour?
Colour: Waves of light, perceived.
Just as there are soundwaves that you can hear 🔉 👂
There are lightwaves that we see 🚥 👀
This combines physics, biology, and a bit of philosophy.
Physics of Colour
These lightwaves come in different shapes - different wavelengths:
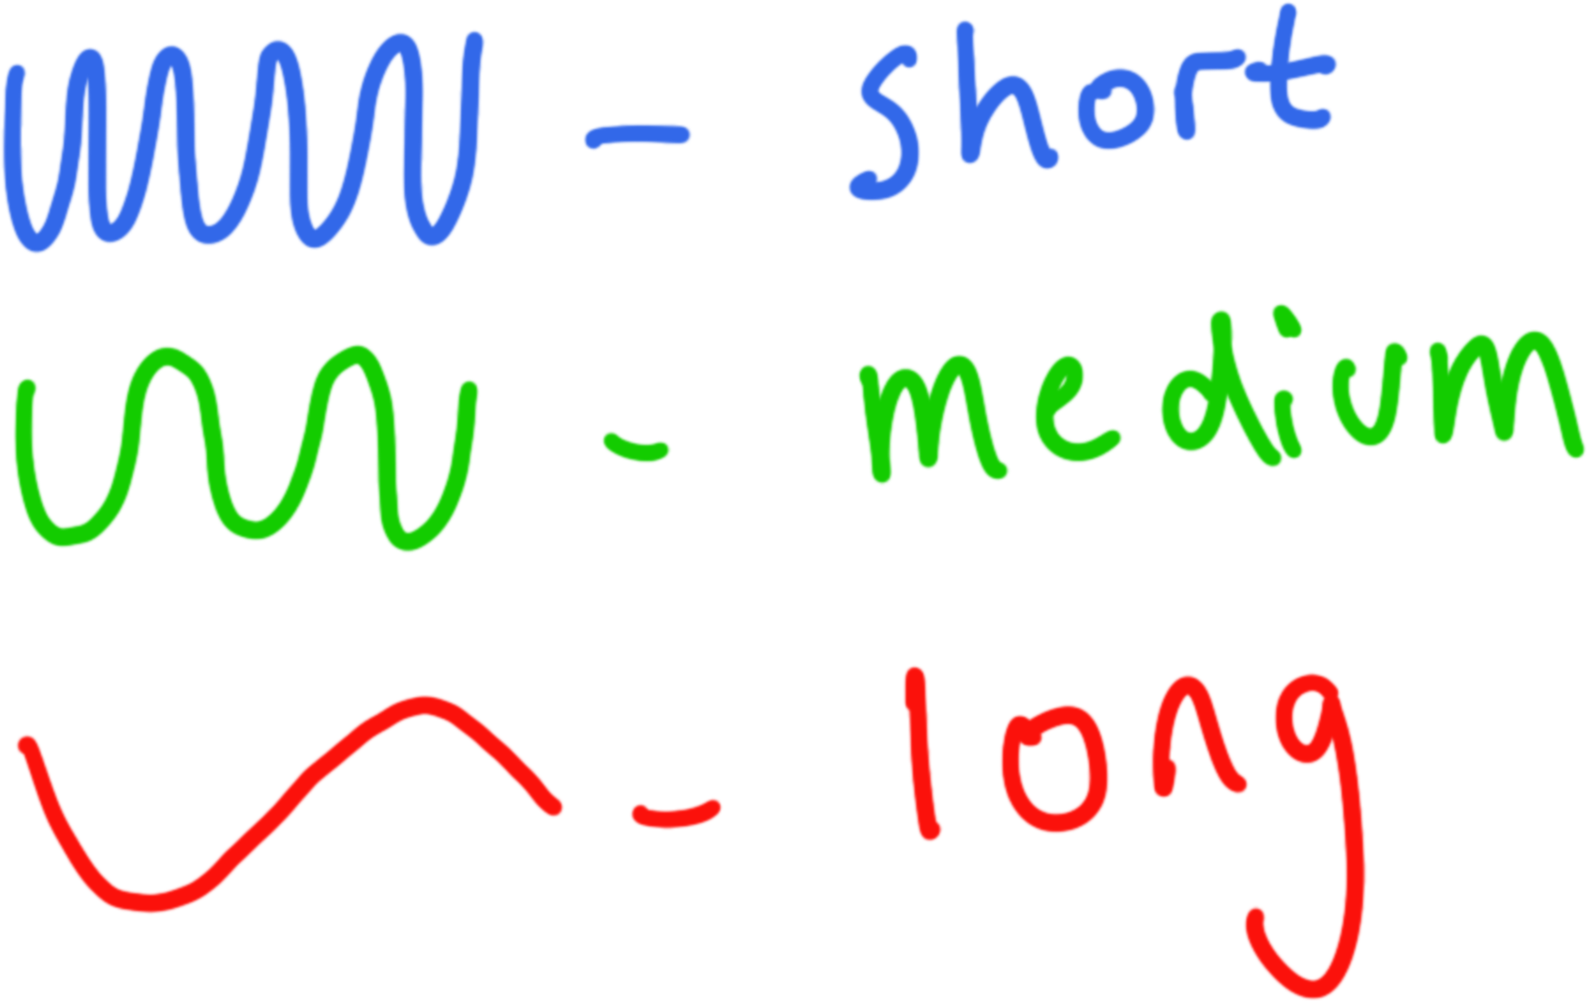
The visible spectrum
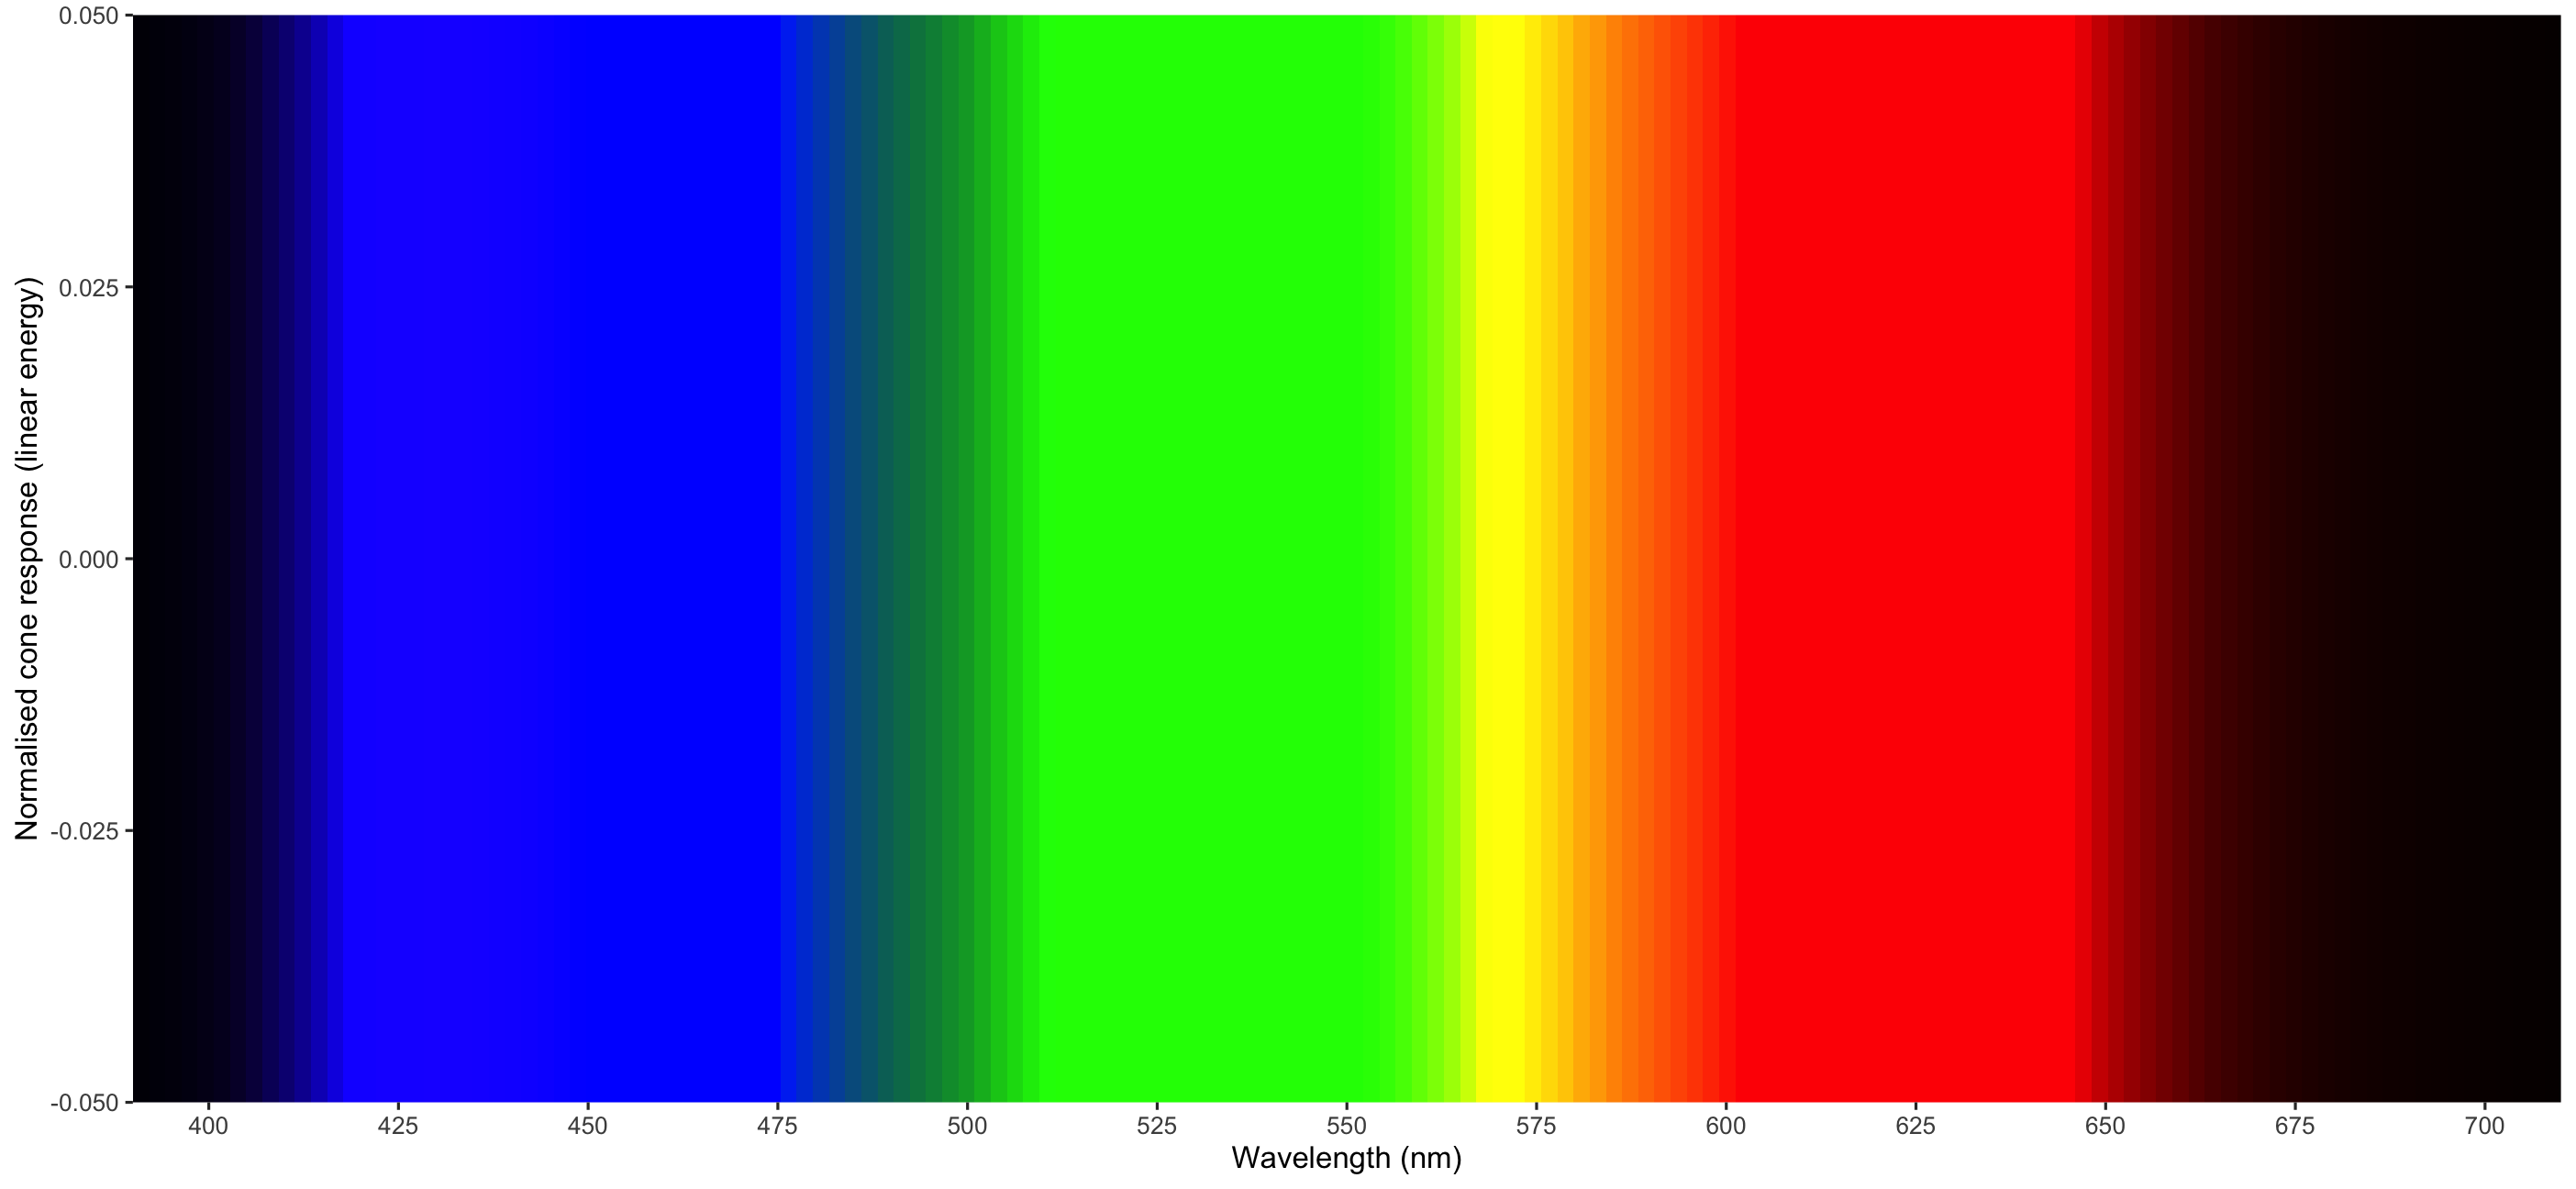
- At this end we have the longest wavelengths
- At this end we have the shortest wavelengths
Physics of Colour (More than we can see)
From https://commons.wikimedia.org/wiki/File:EM_spectrum.svg

This work is licensed under a Creative Commons Attribution-ShareAlike 3.0 Unported License.
- Note that this is just a tiny slice of the light spectrum
- We just happen to be able to see this range of colours
- But How?
Physics of Colour
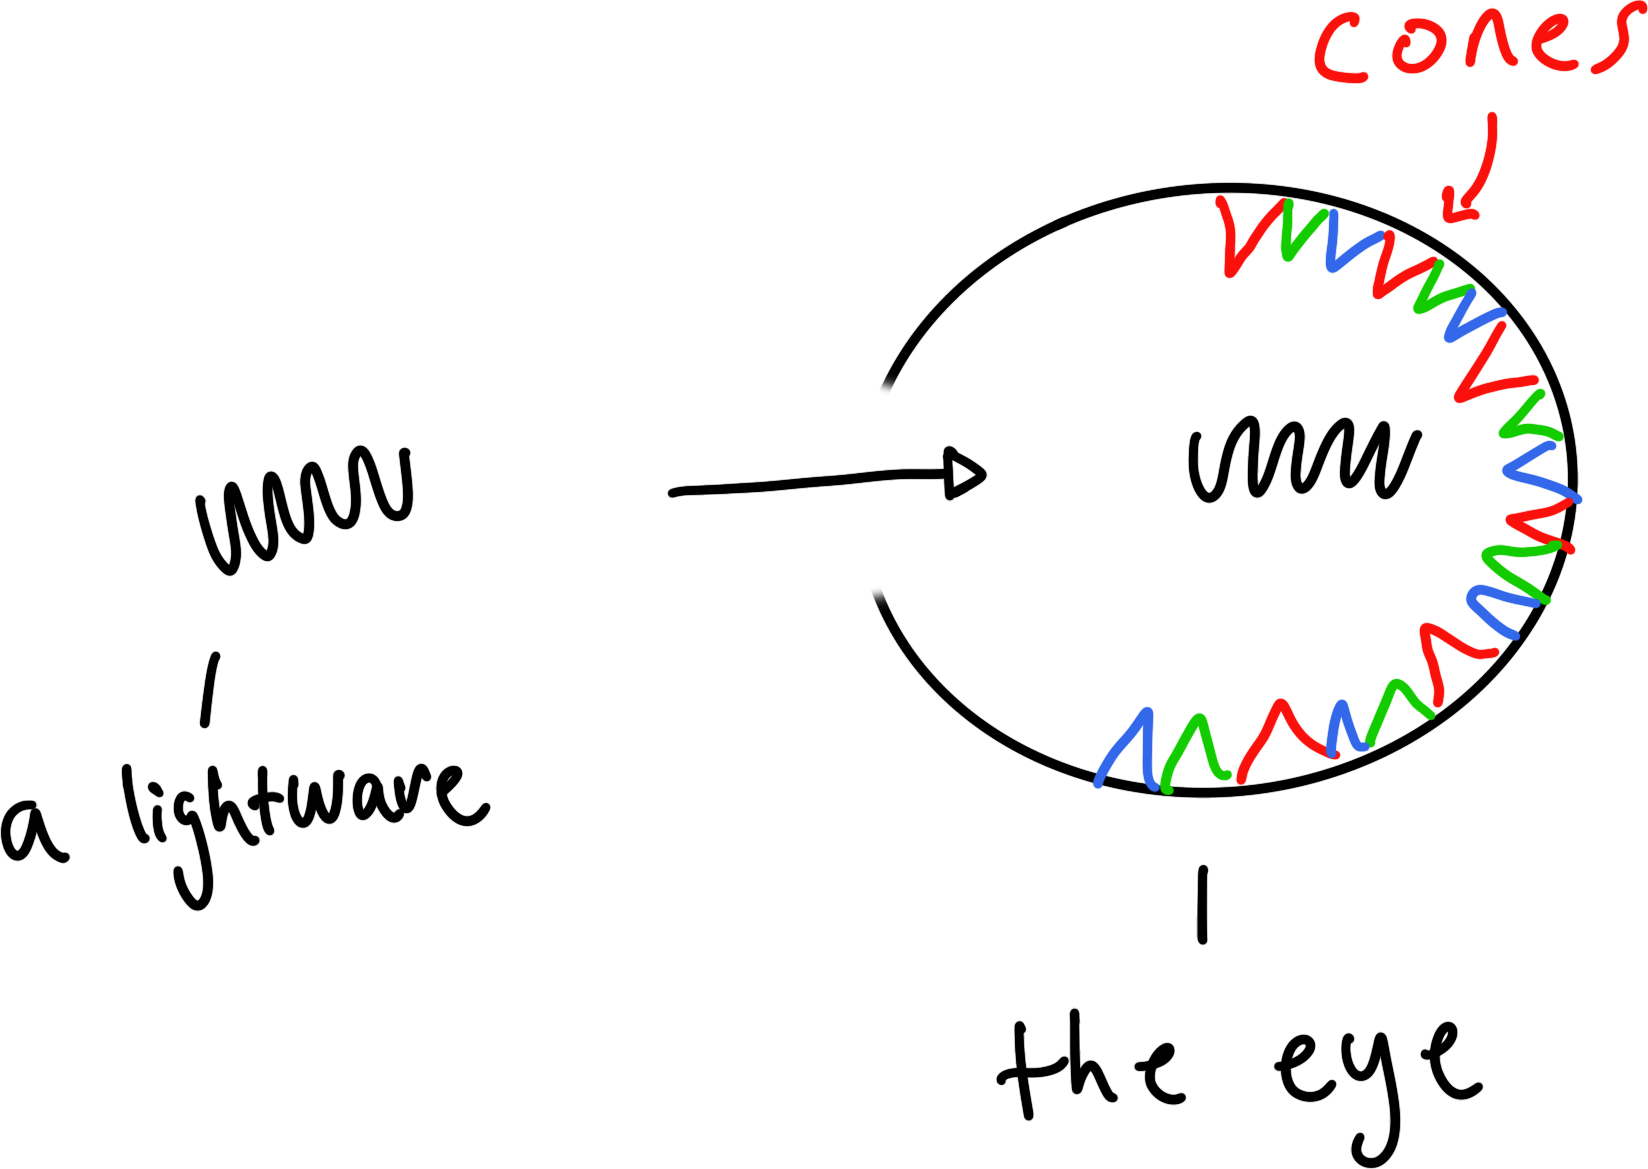
Lightwaves enter our eyes, and we have the perception of colour.
- Shorter wavelengths = "purple" / "blue
- longer wavelengths = "red"
As light enters the eye, it hits cells that are sensitive to light.
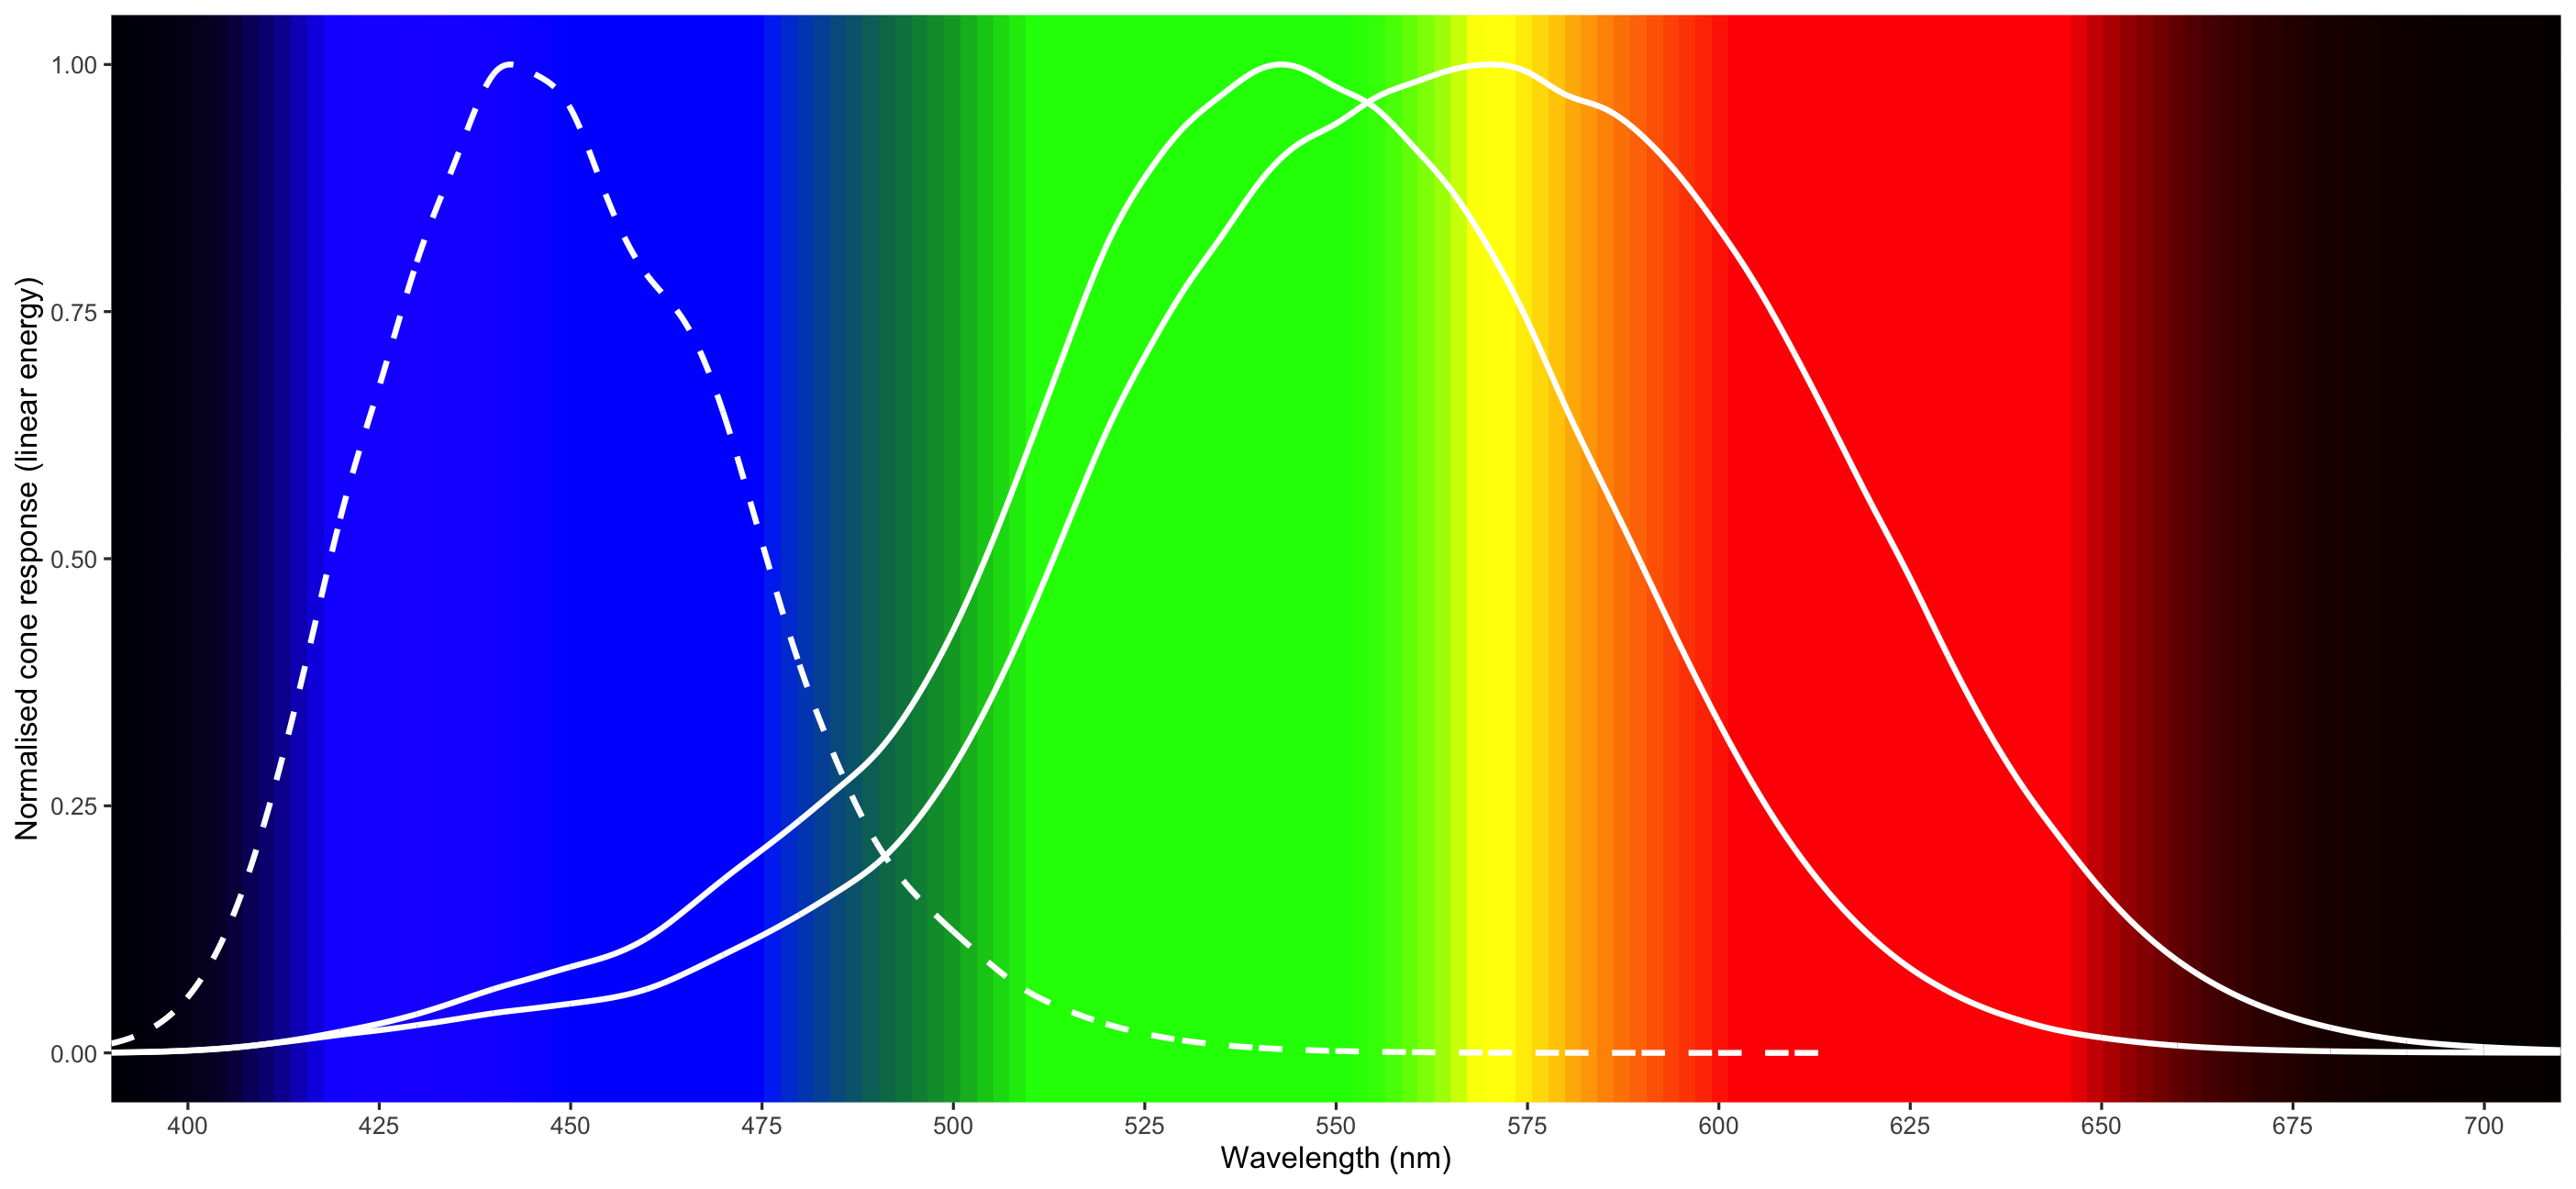
- These cells are called rods and cones.
- The cones are the bits that allow us to see colour
Biology of colour: cones
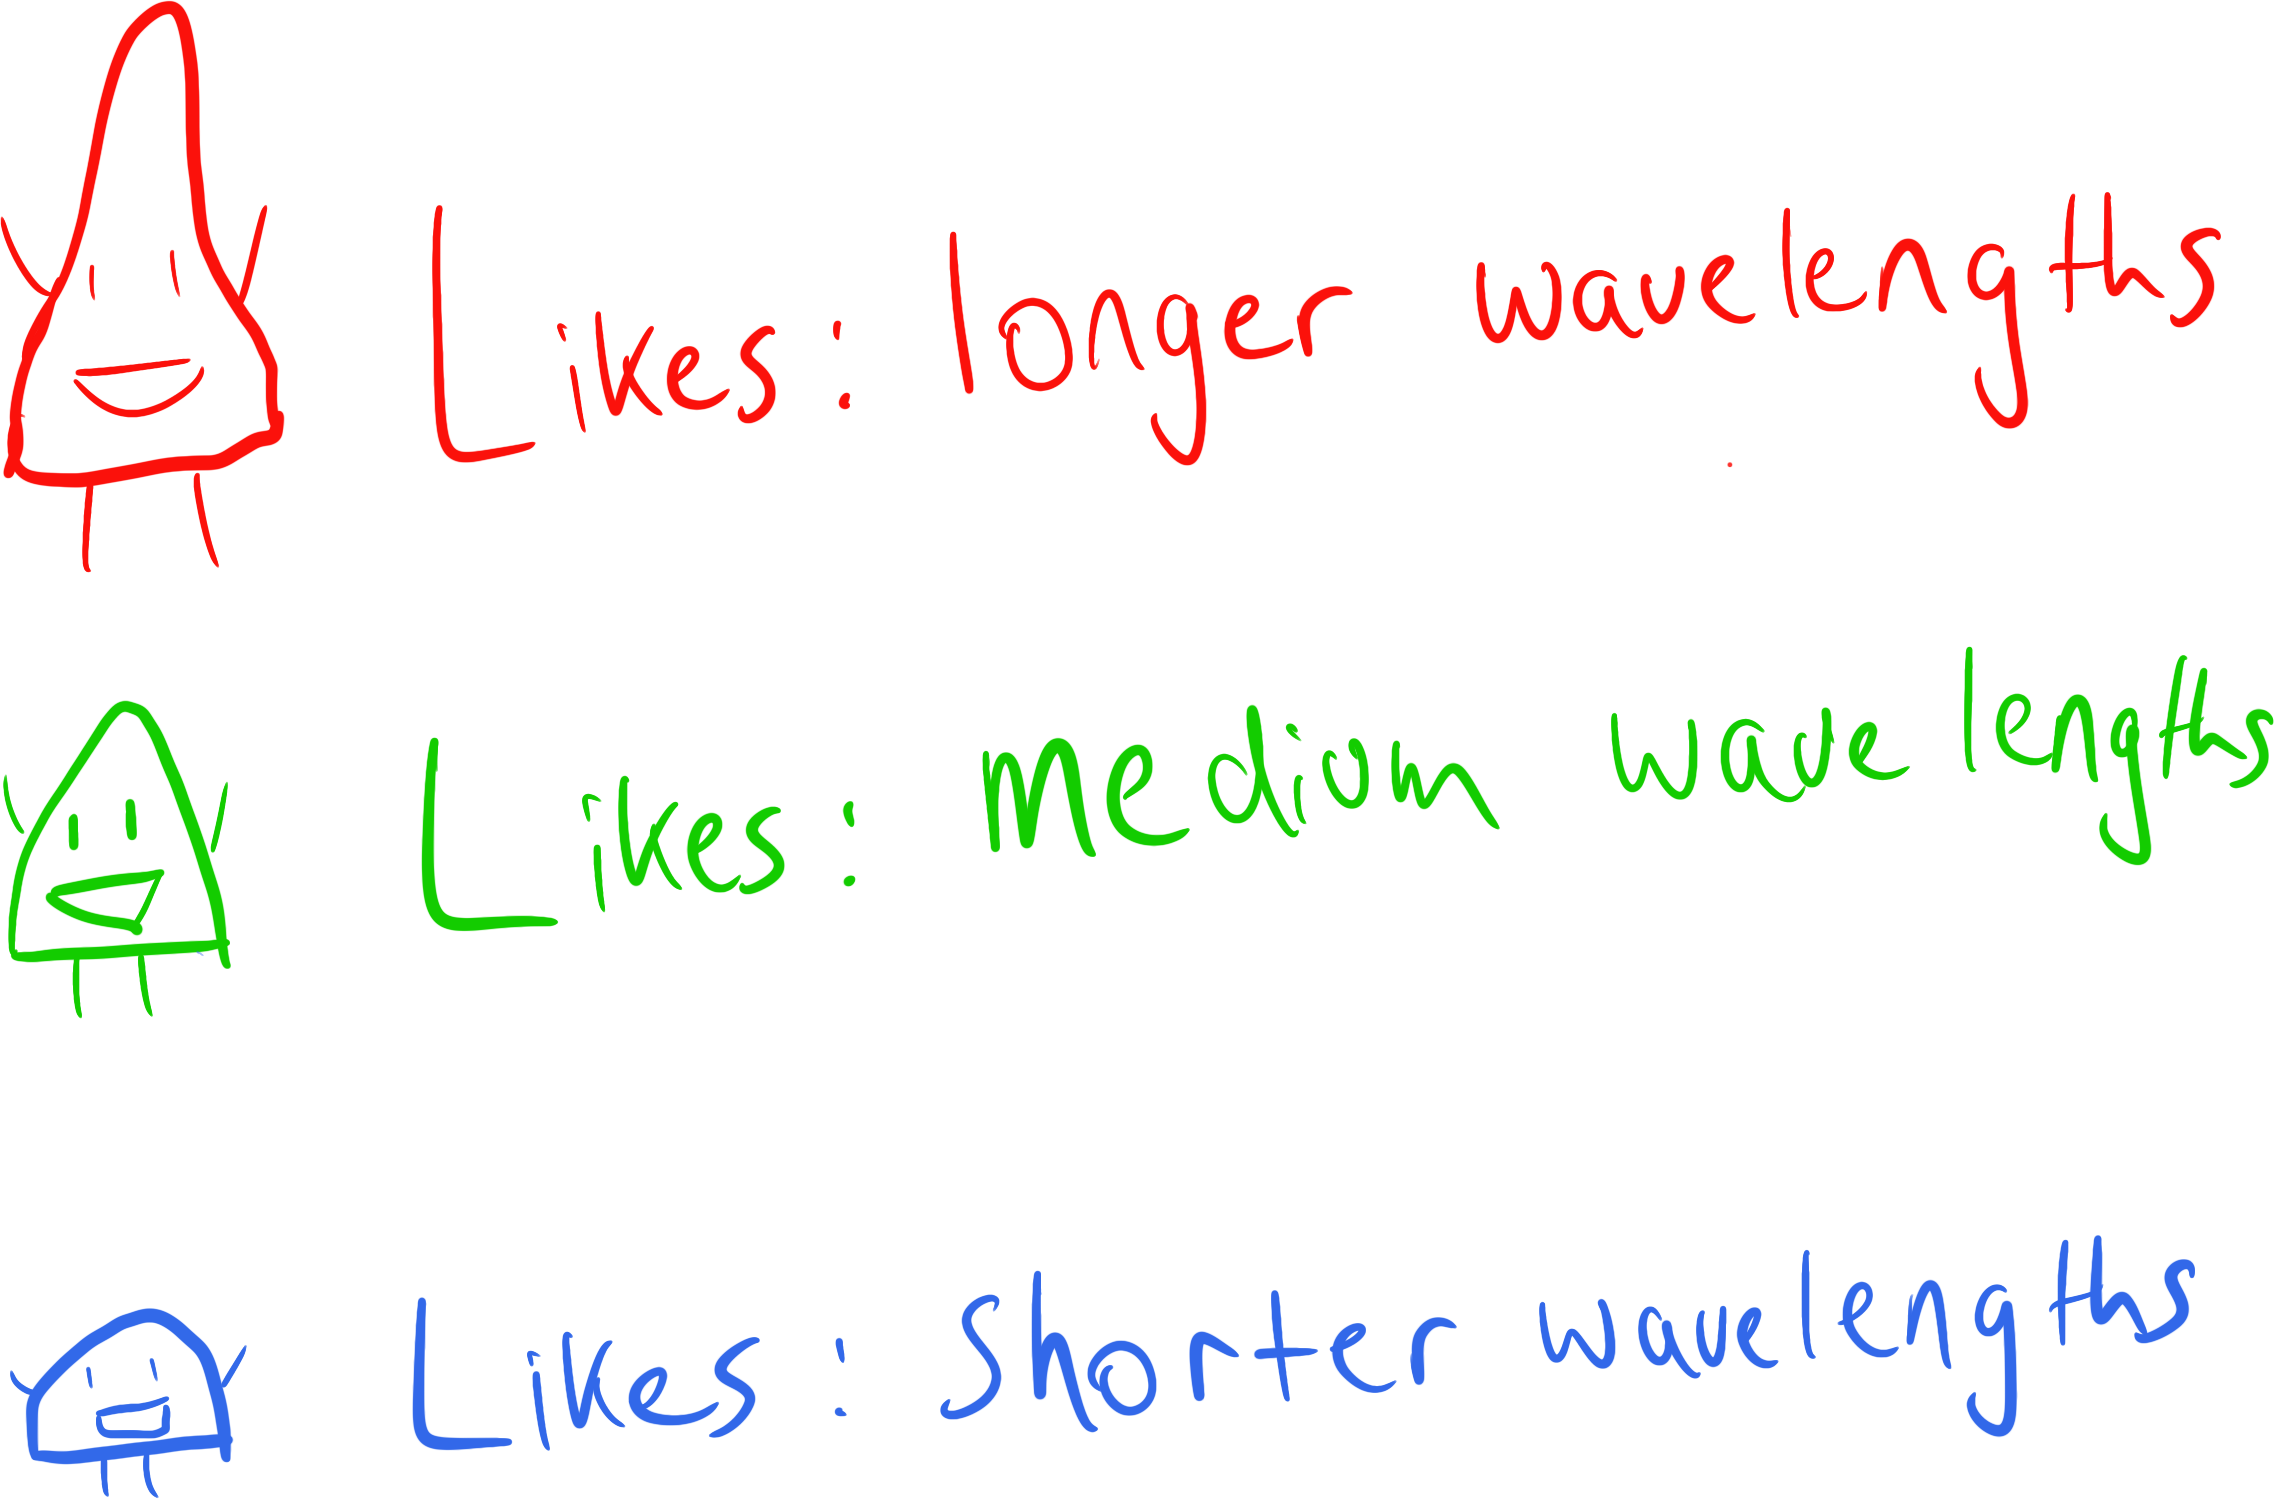
- If we get only one type of colour entering in the eye, we get one colour.
- This is because of these three cones:
- Colours are brighter when there is more of the light
- most colours are a combination of multiple wave lengths
Biology of colour: cone sensitivty to light
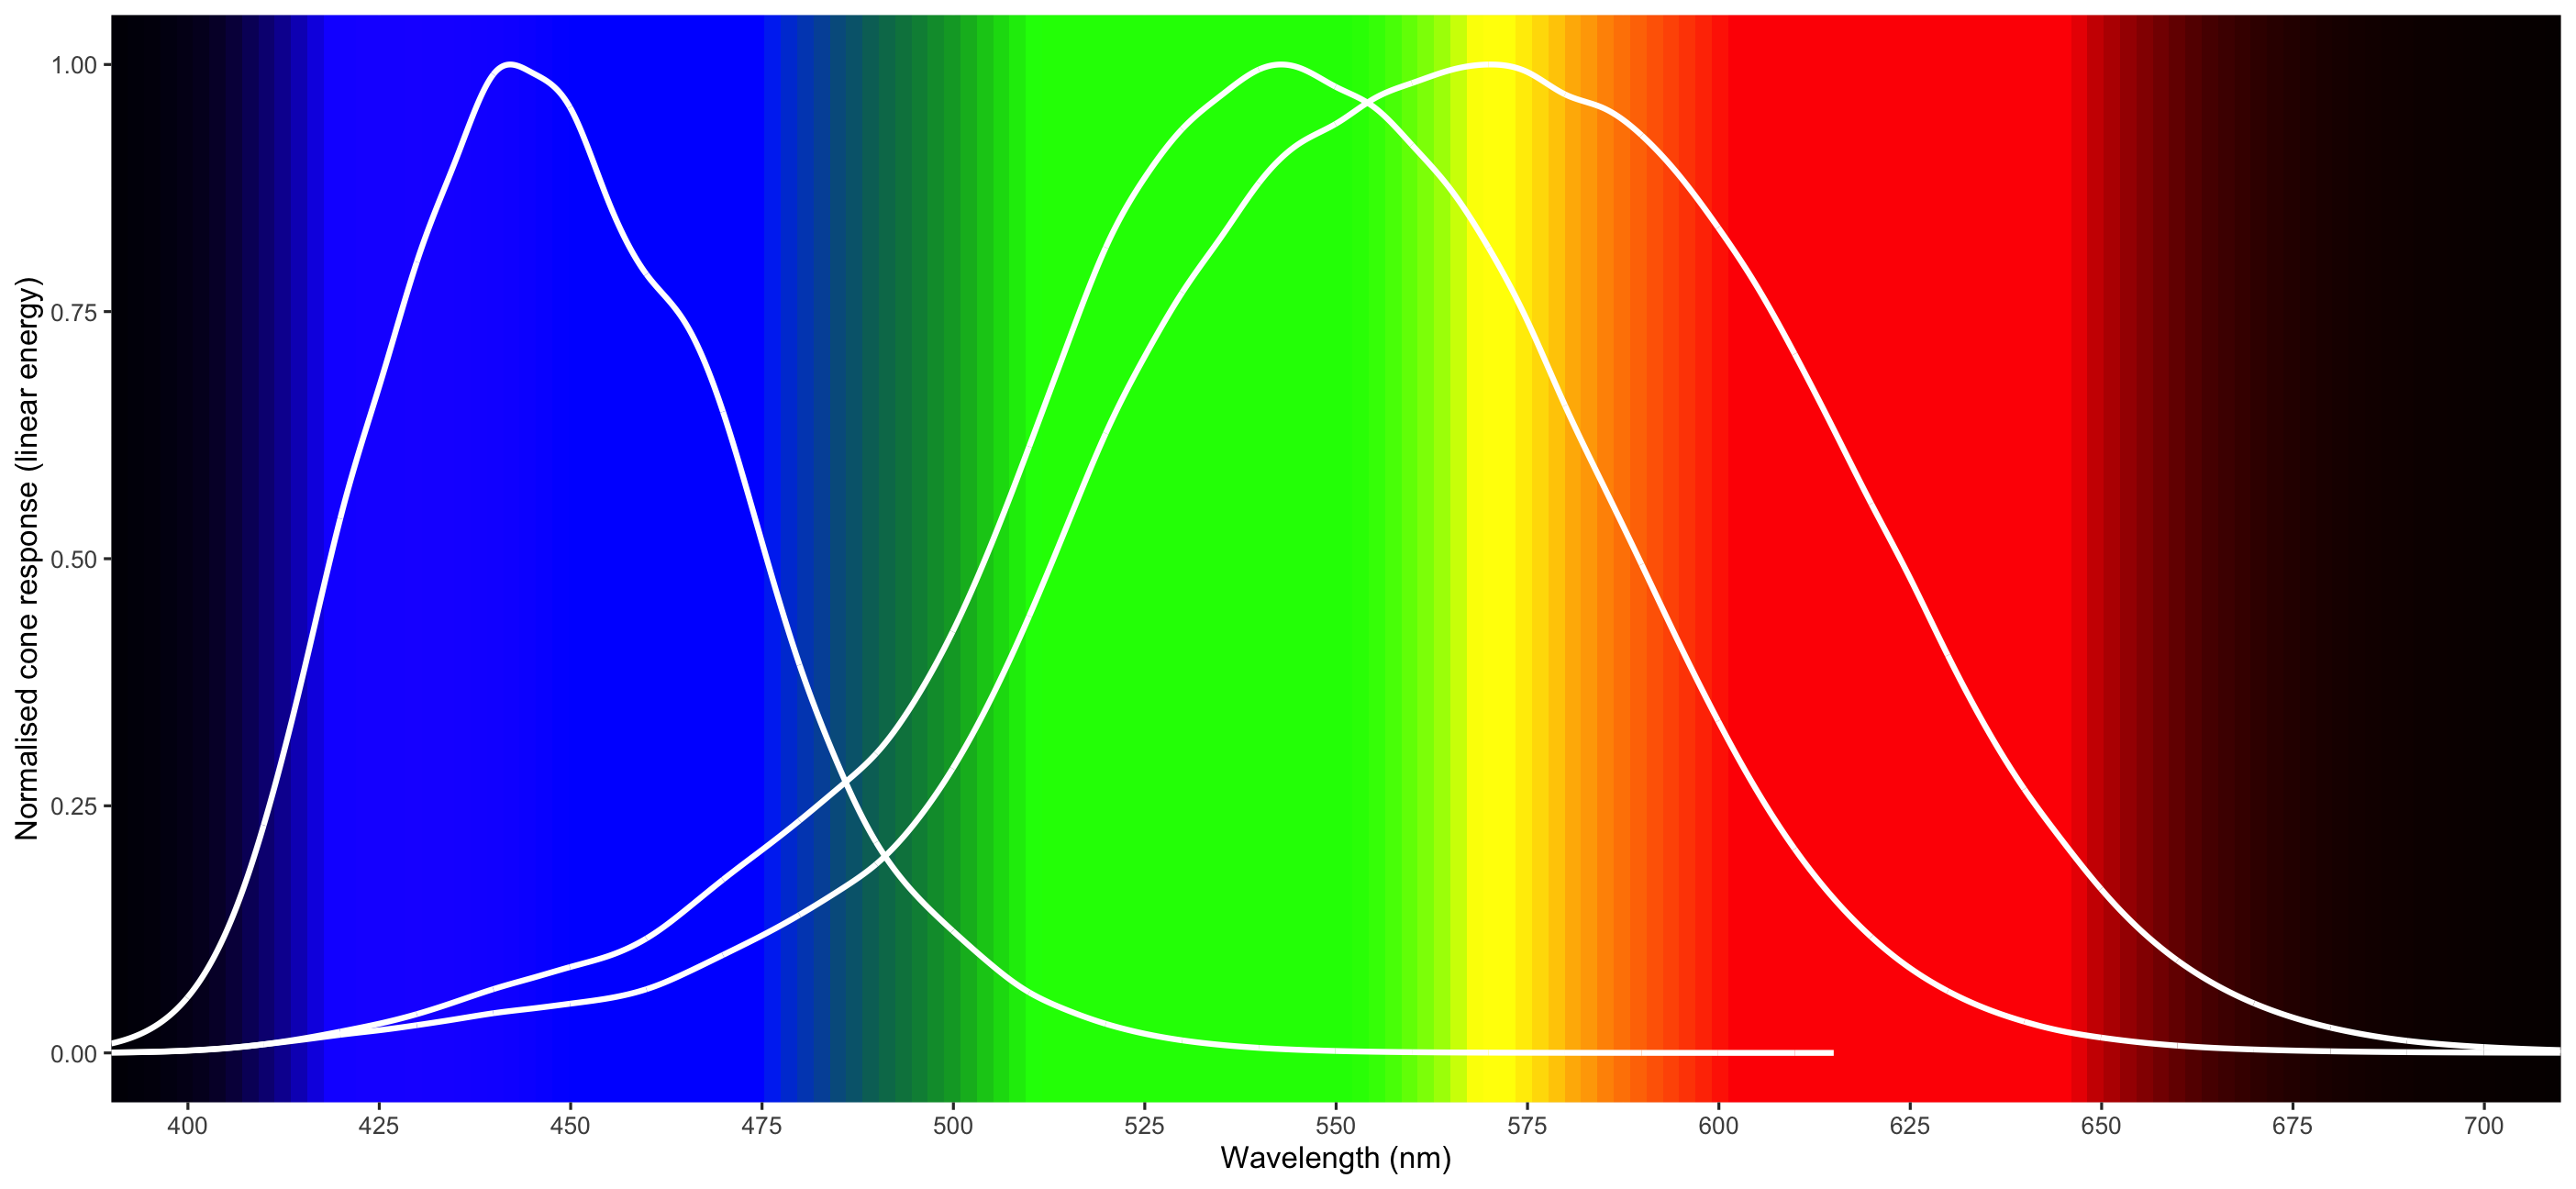
Image inspired by figure of responsivity of human eye from Wikipedia, data extracted from Colour & Vision Research laboratory at UCL's section on cones.
How do we see colour? Blue?
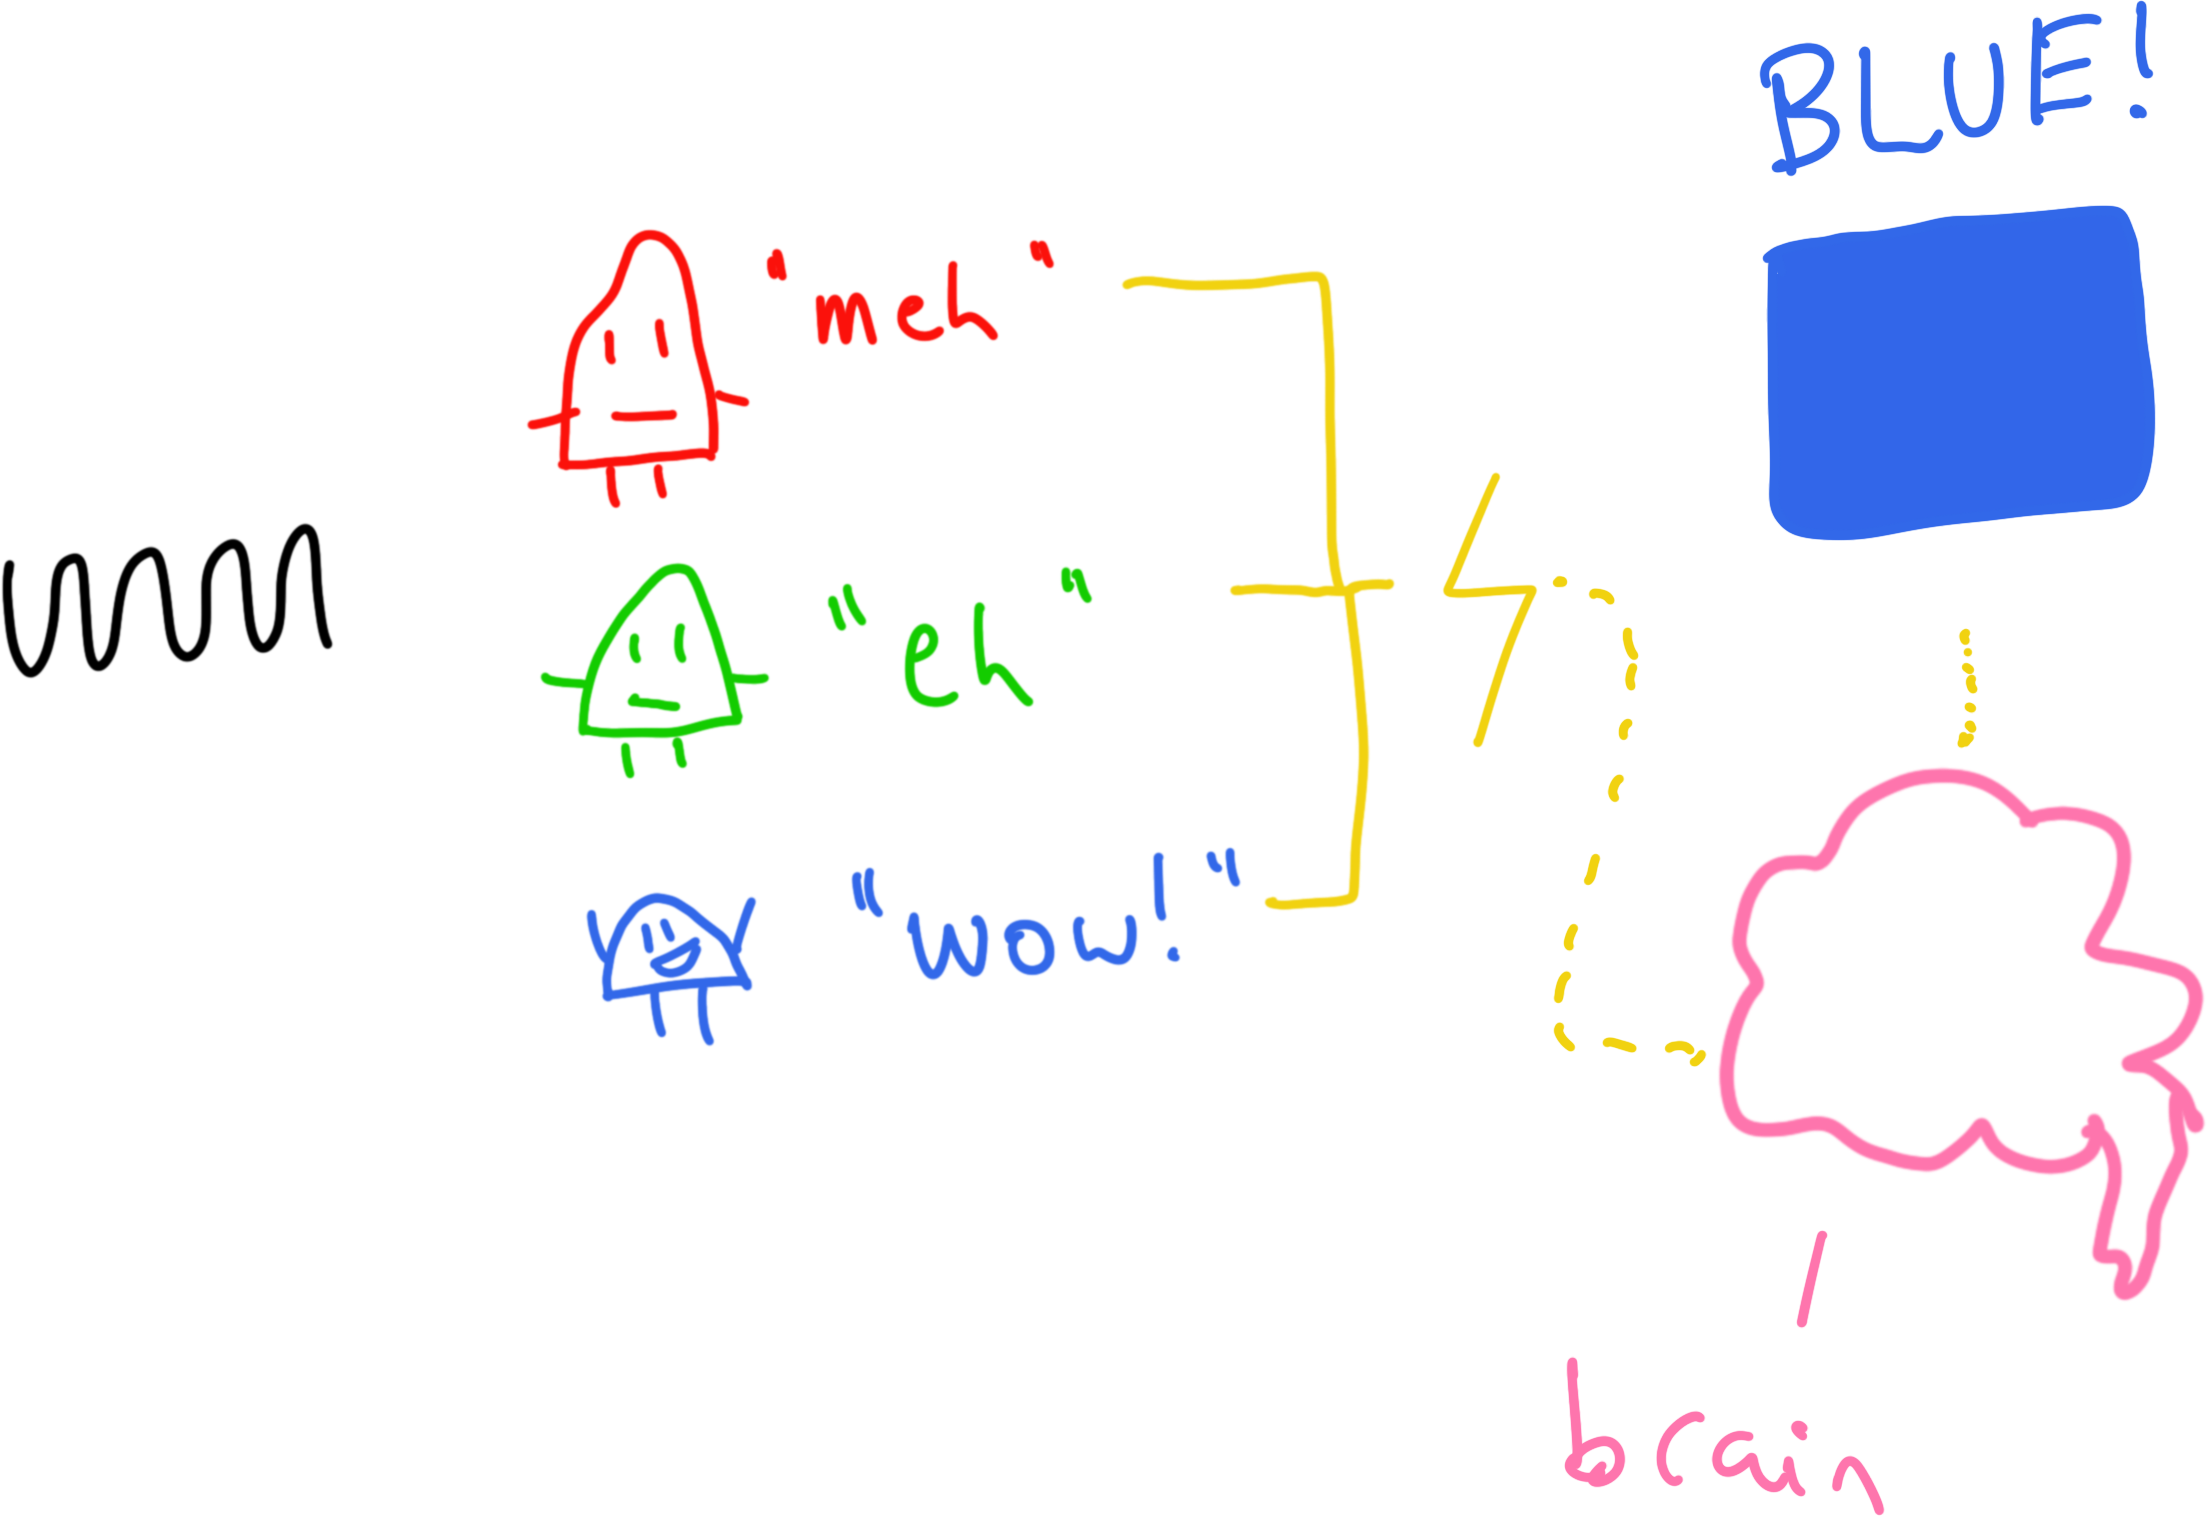
So what happens when we are exposed to a lot of these longer wavelengths of "red" light?
- Long cones react
- Medium cones not so much
- S cones not at all
That information is then taken in to your brain and then you have the sensation of "red".
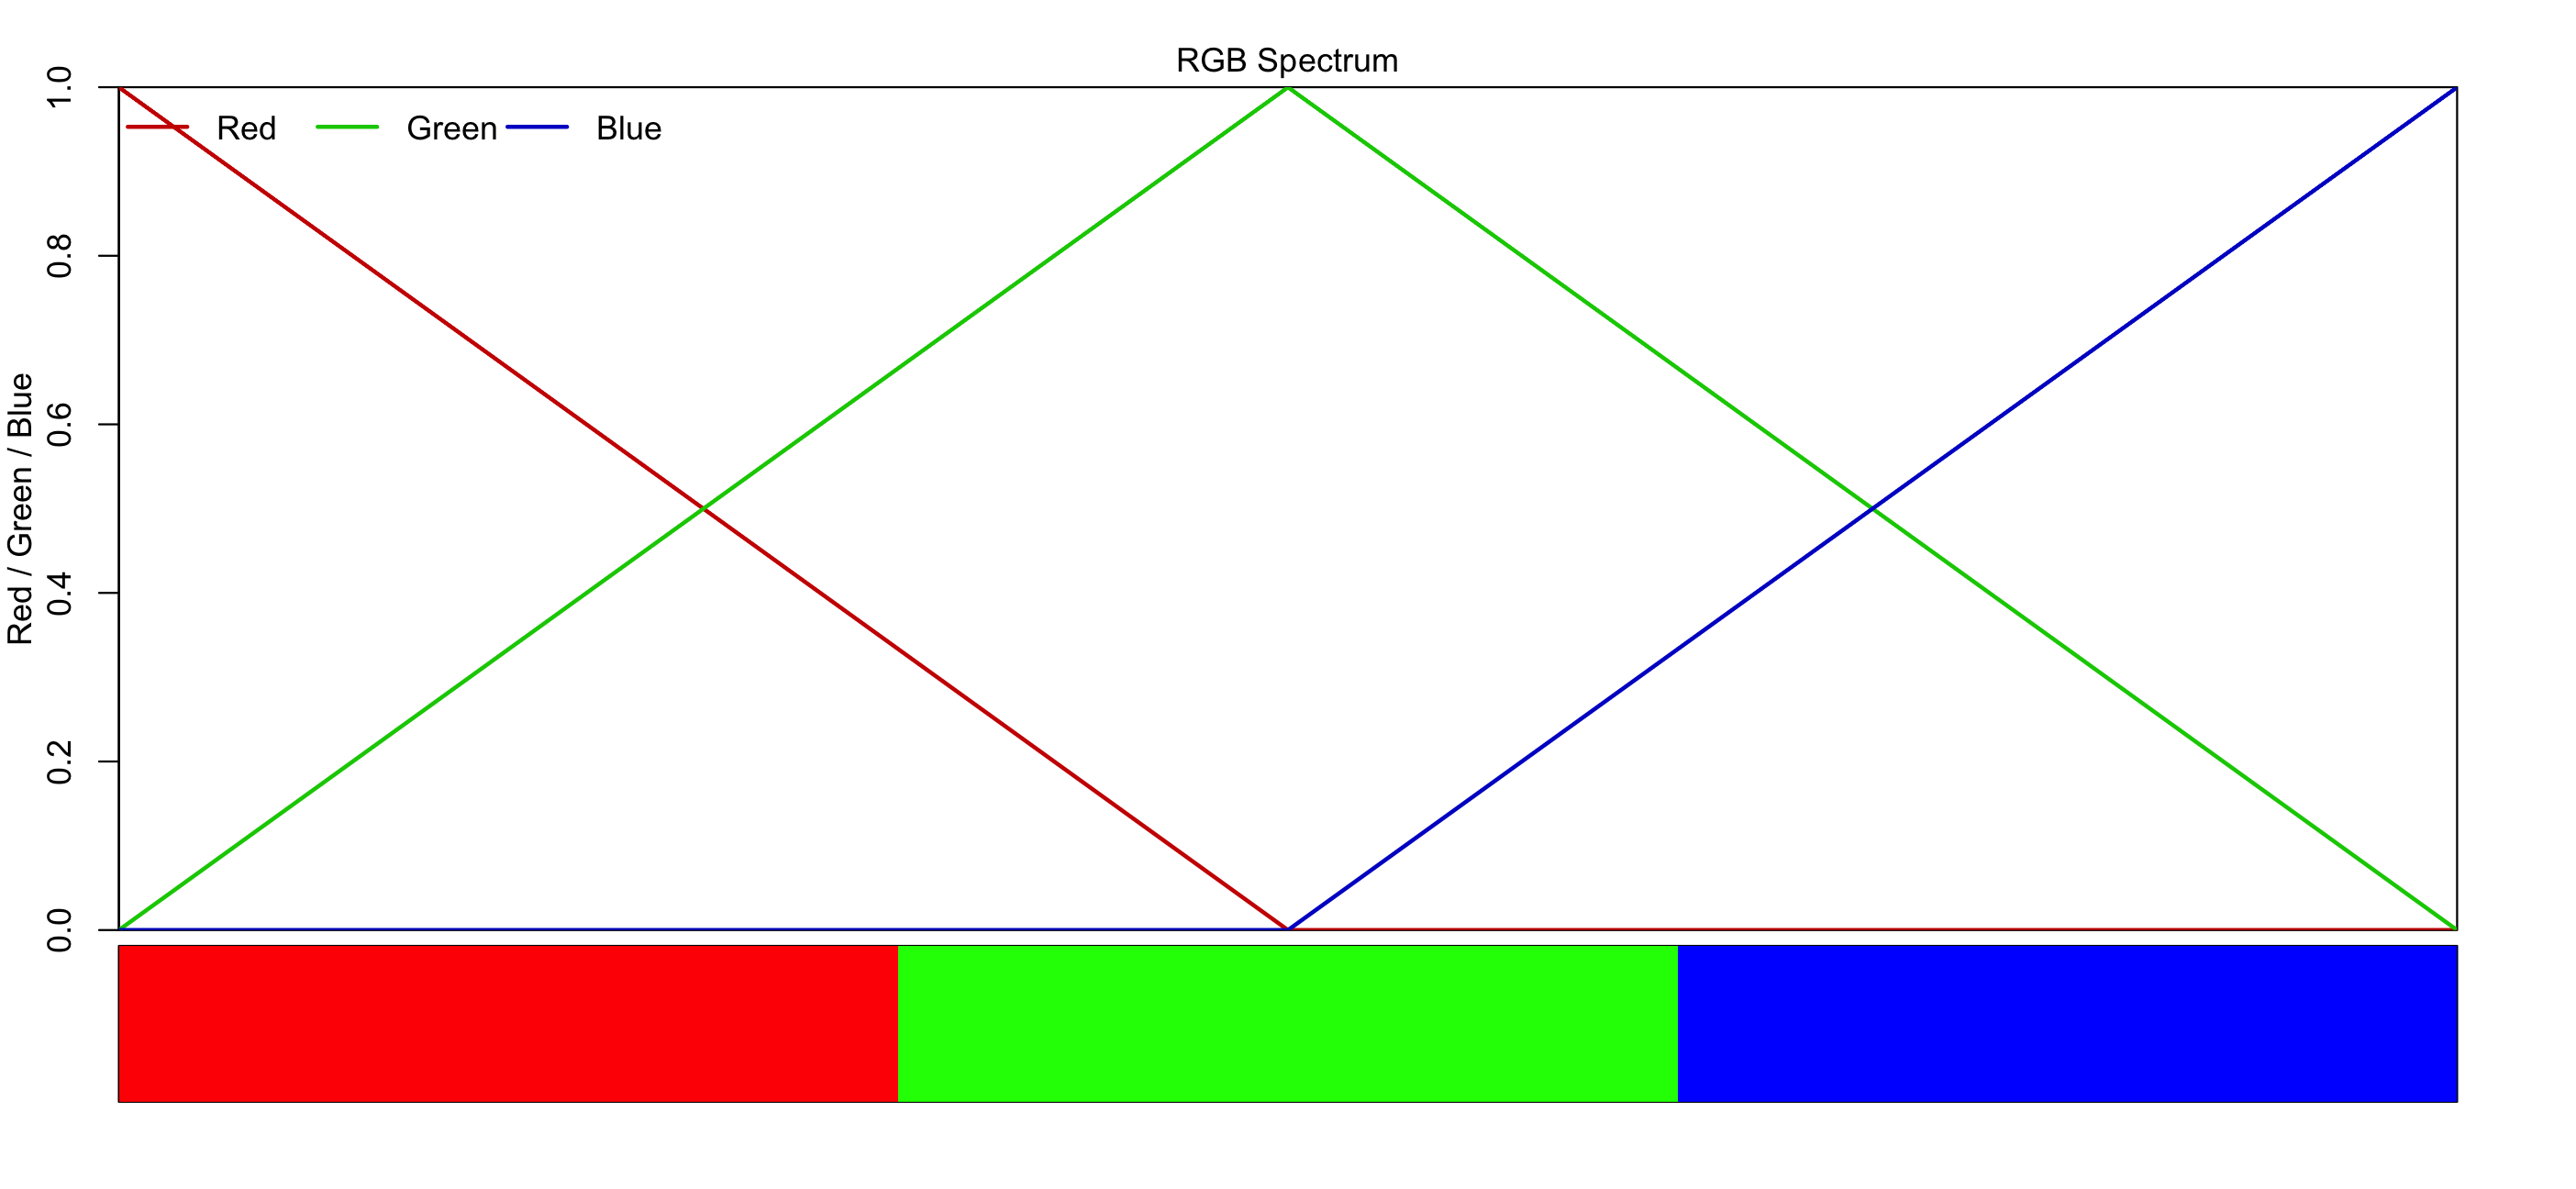
But I don't just see red and green and blue?
Well, kinda?
But I don't just see red and green and blue?
Well, kinda?
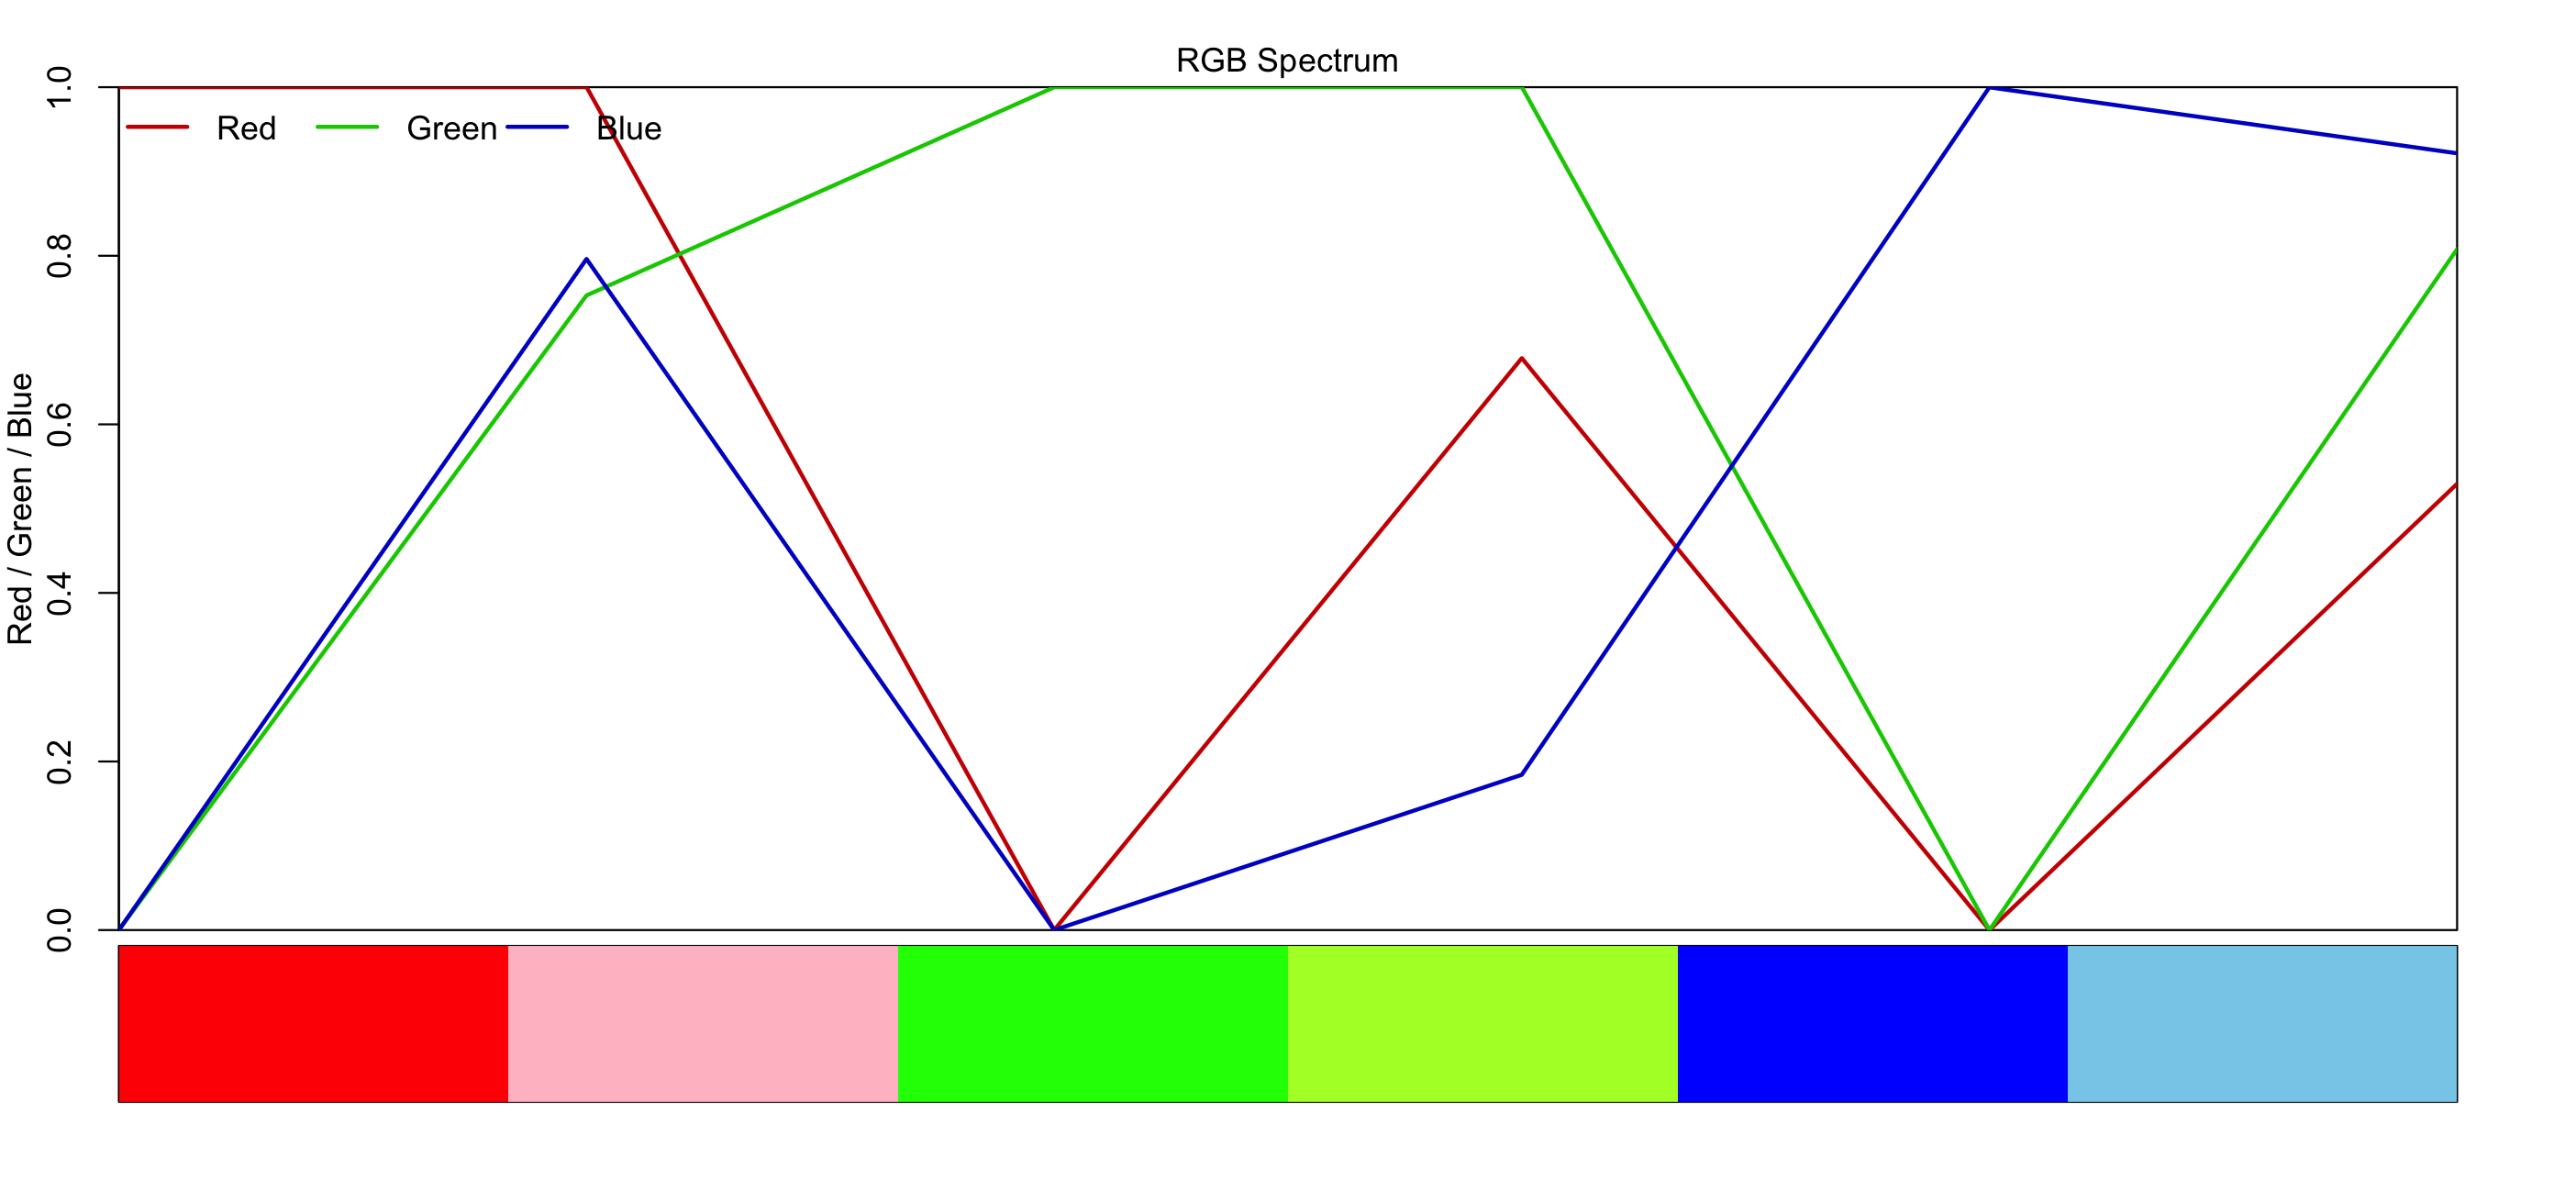
- Colour is made up of the combination of light entering our eye.
- Red could be some of ..., and some of ...
- Orange could be
- White could be all colours, or it could just be
There are actually many different combinations of light waves that can get us to see different colours.
This means that colour is not just a single light waves, or a combination of many, but it is our perception of light
Colourblindness
What happens if someone doesn't have some of these cones?
Or one of the cones isn't as responsive?
This is what we call colourblindness and colourweakness
Depending on which cones are missing, this means some sets of colours are indistinguishable from one another.
It affects up to 10% of males of European descent, and 1 in 200 women.
Full colour vision
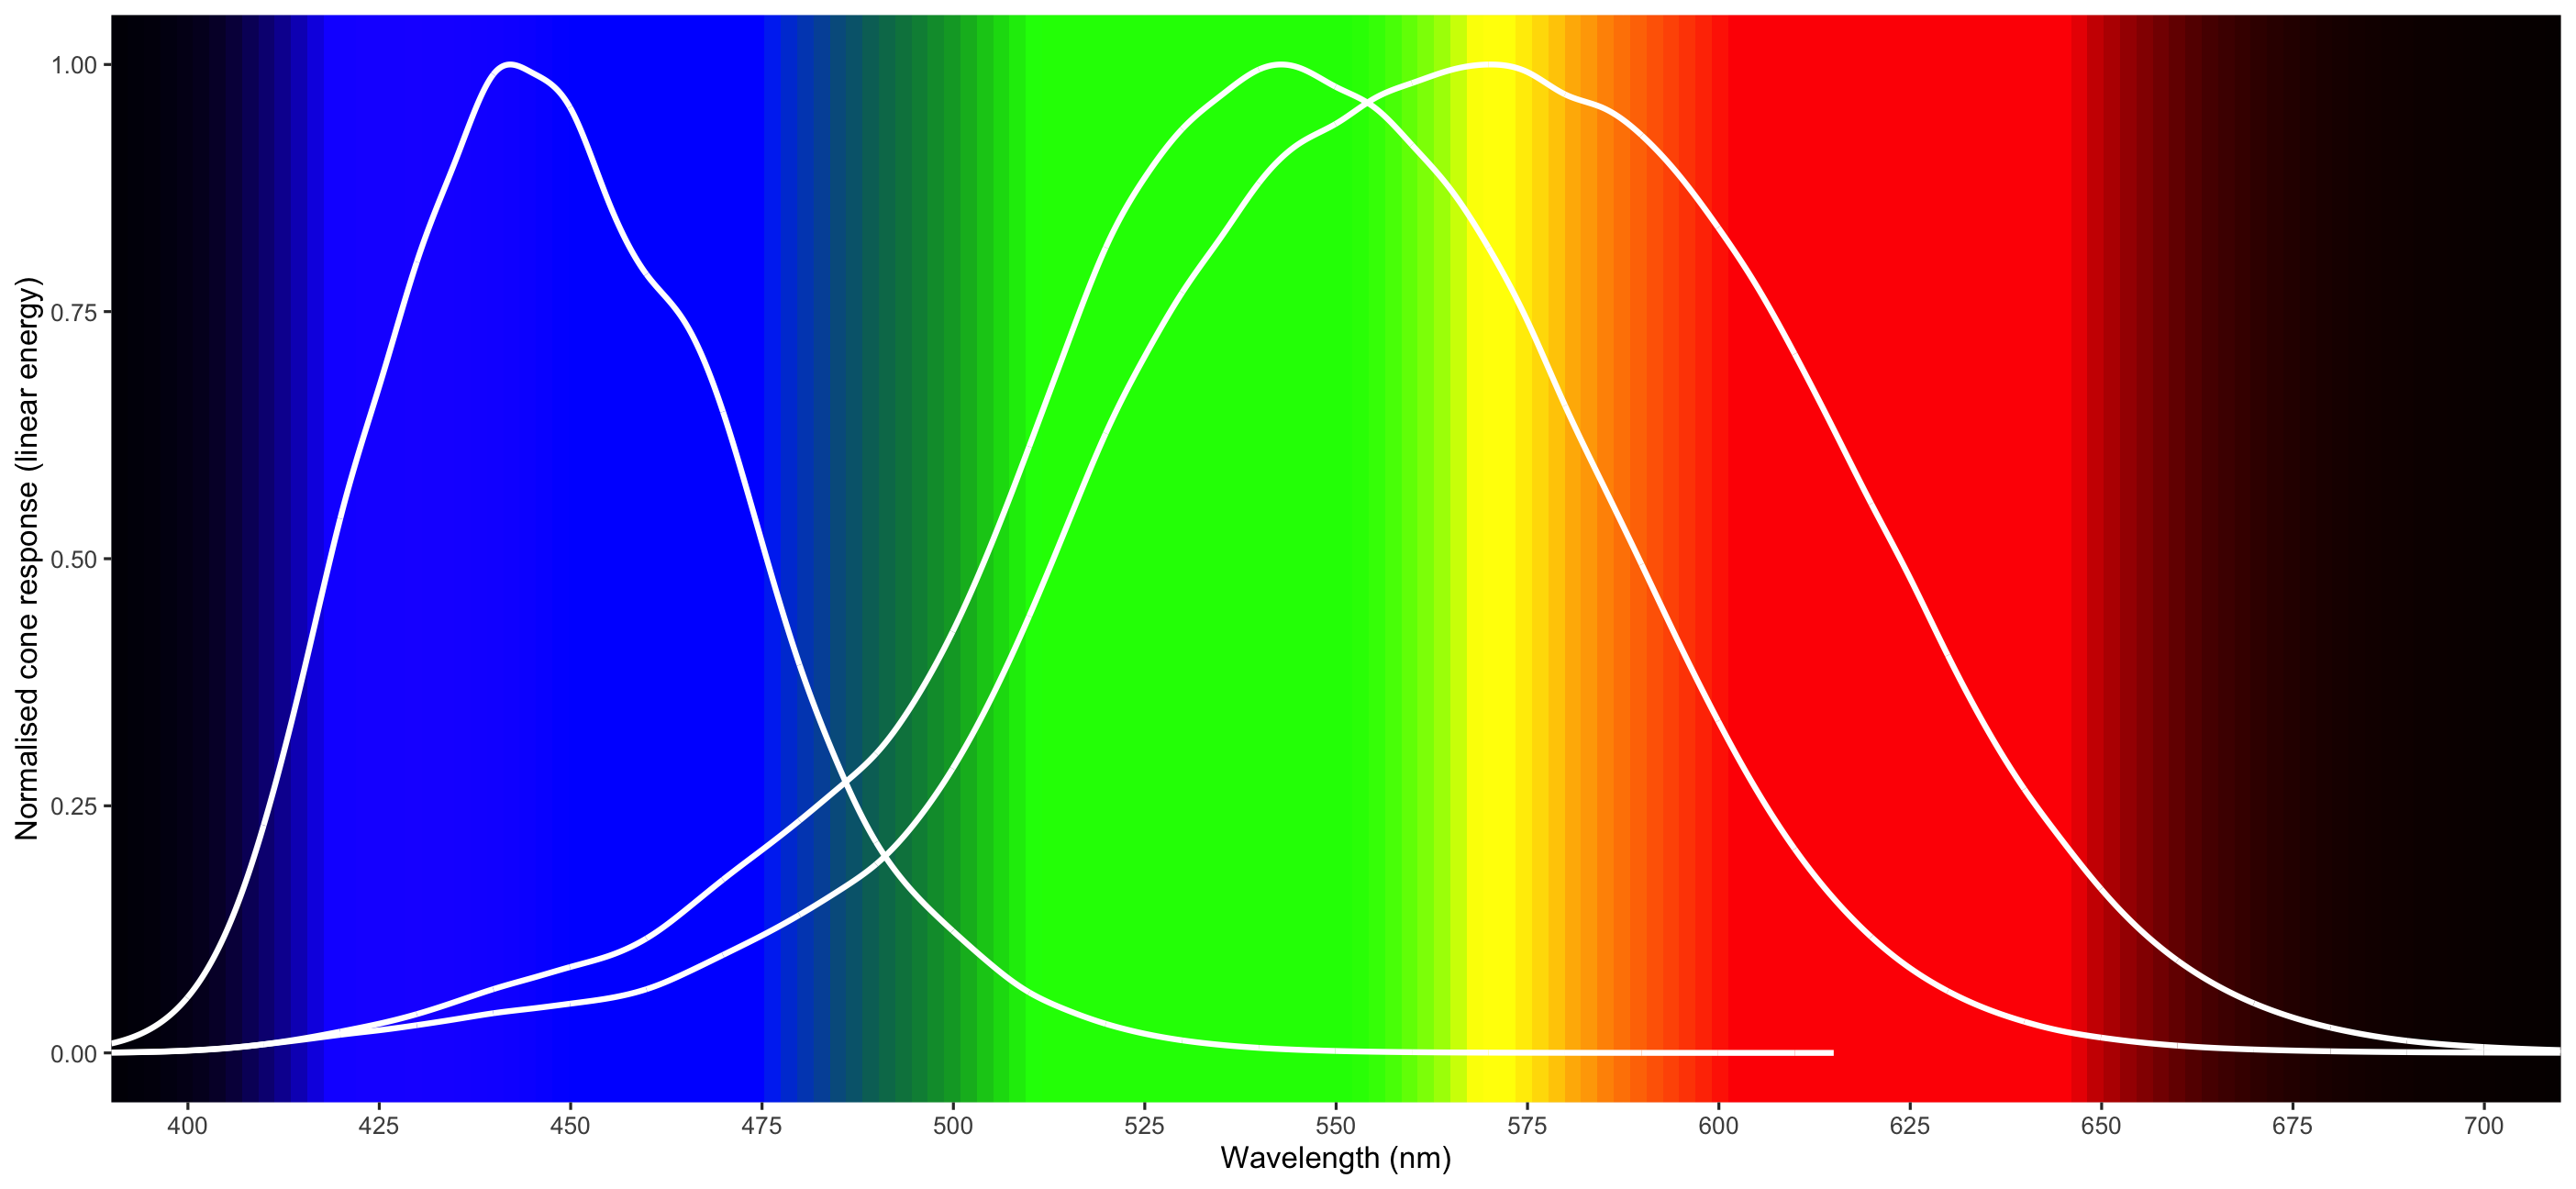
No L cone = Protonopia (Less "red")
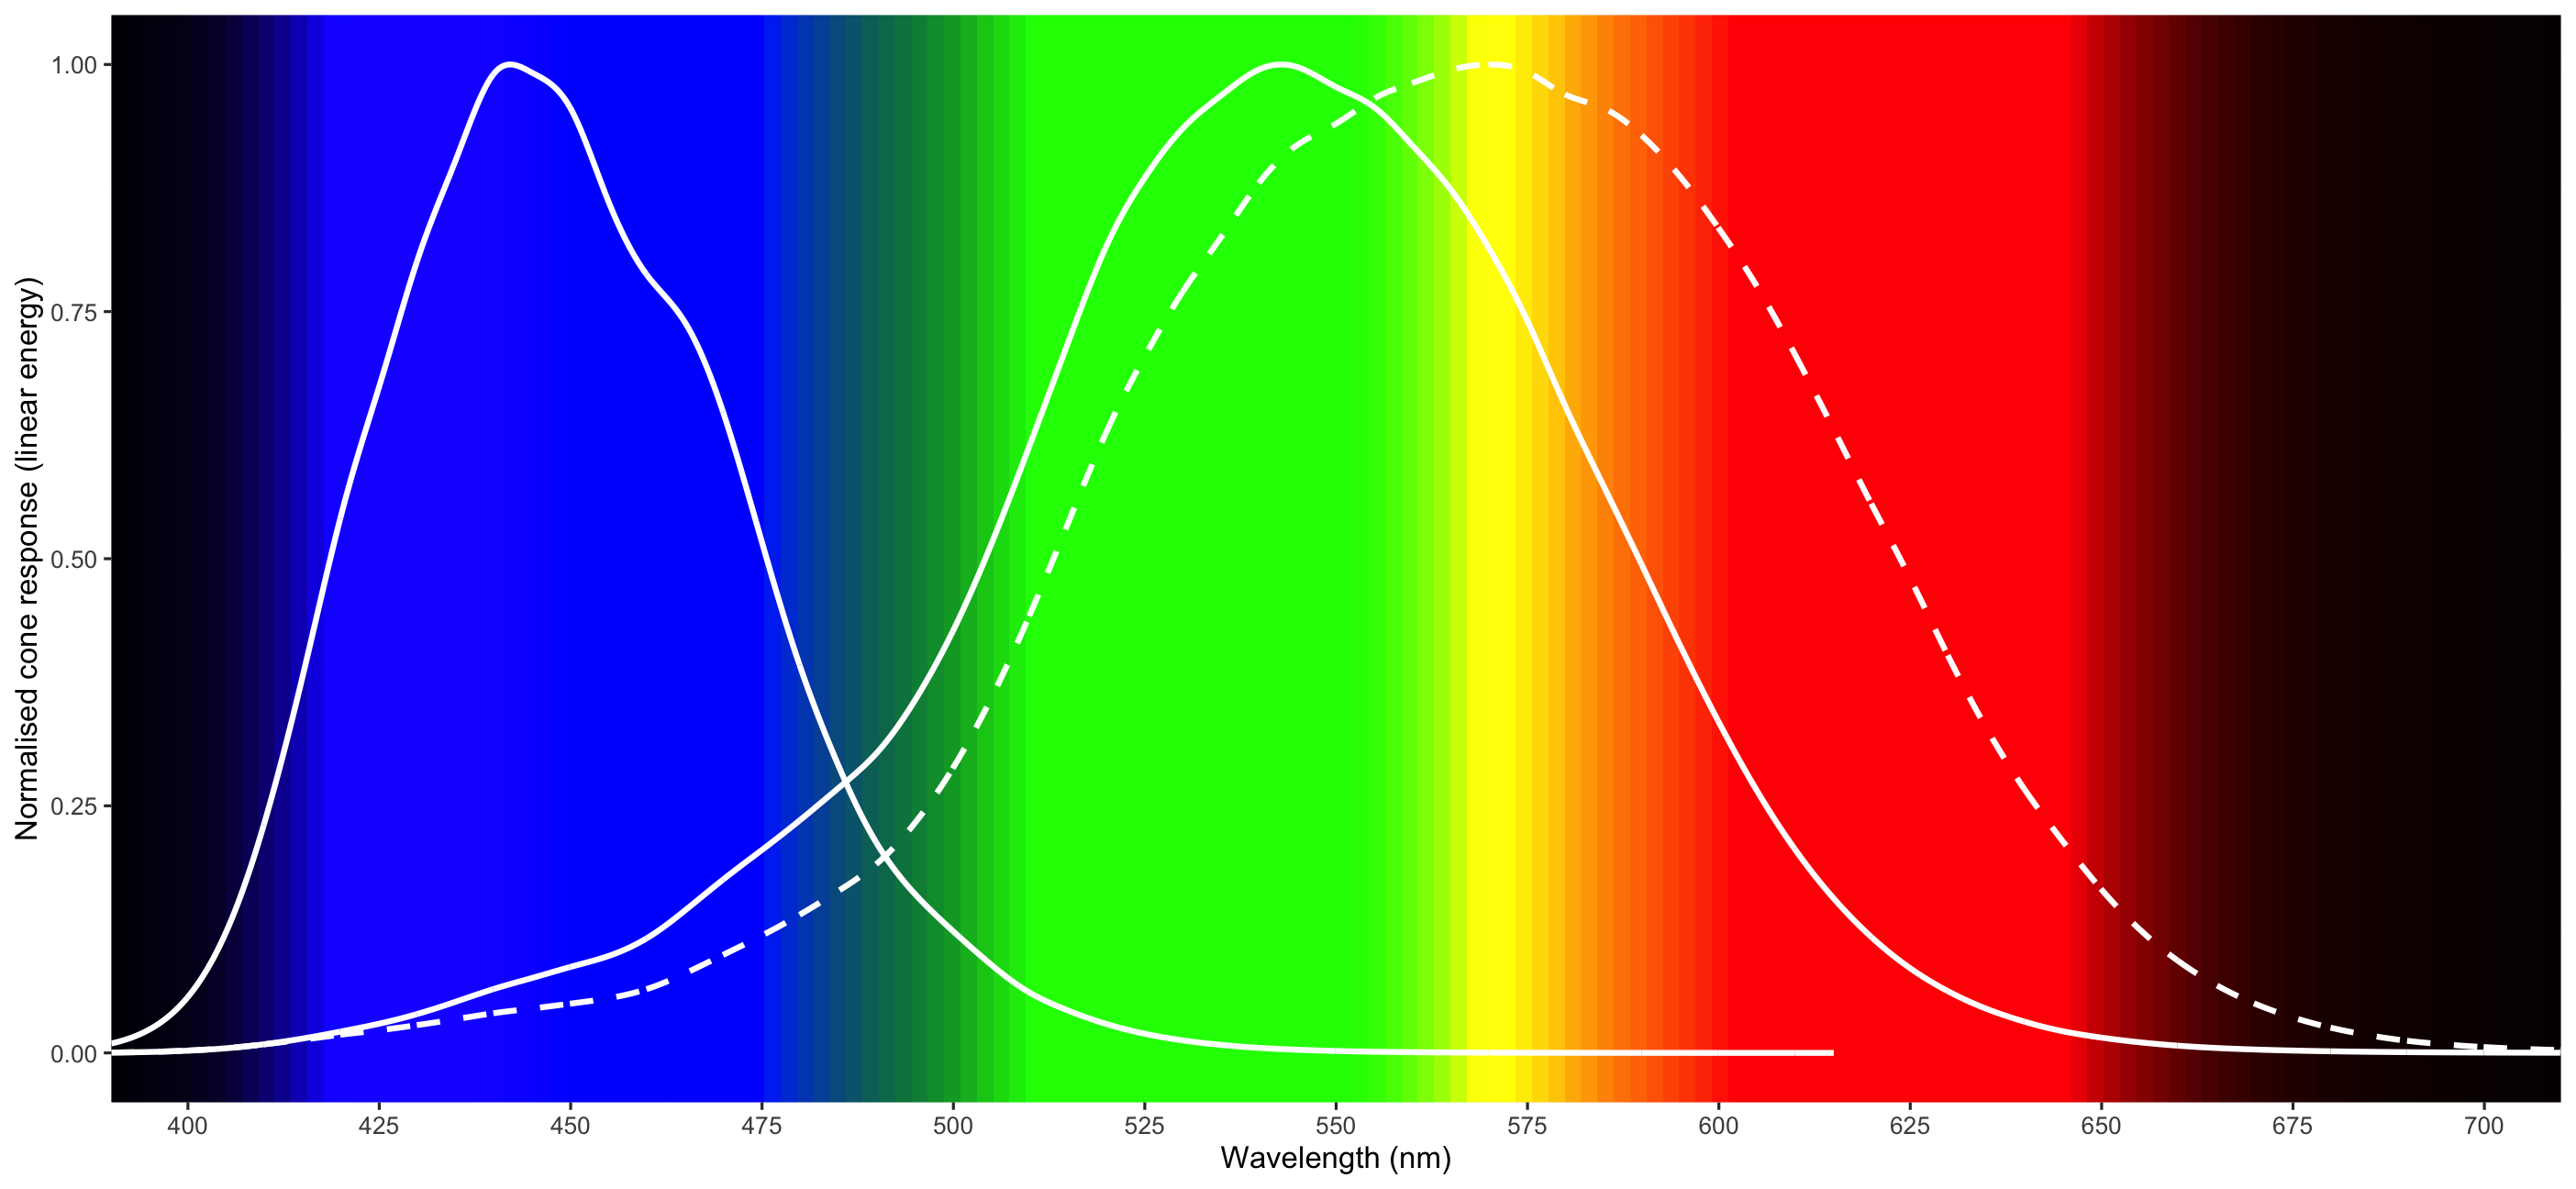
No M cone = Deutanopia (Less "green")
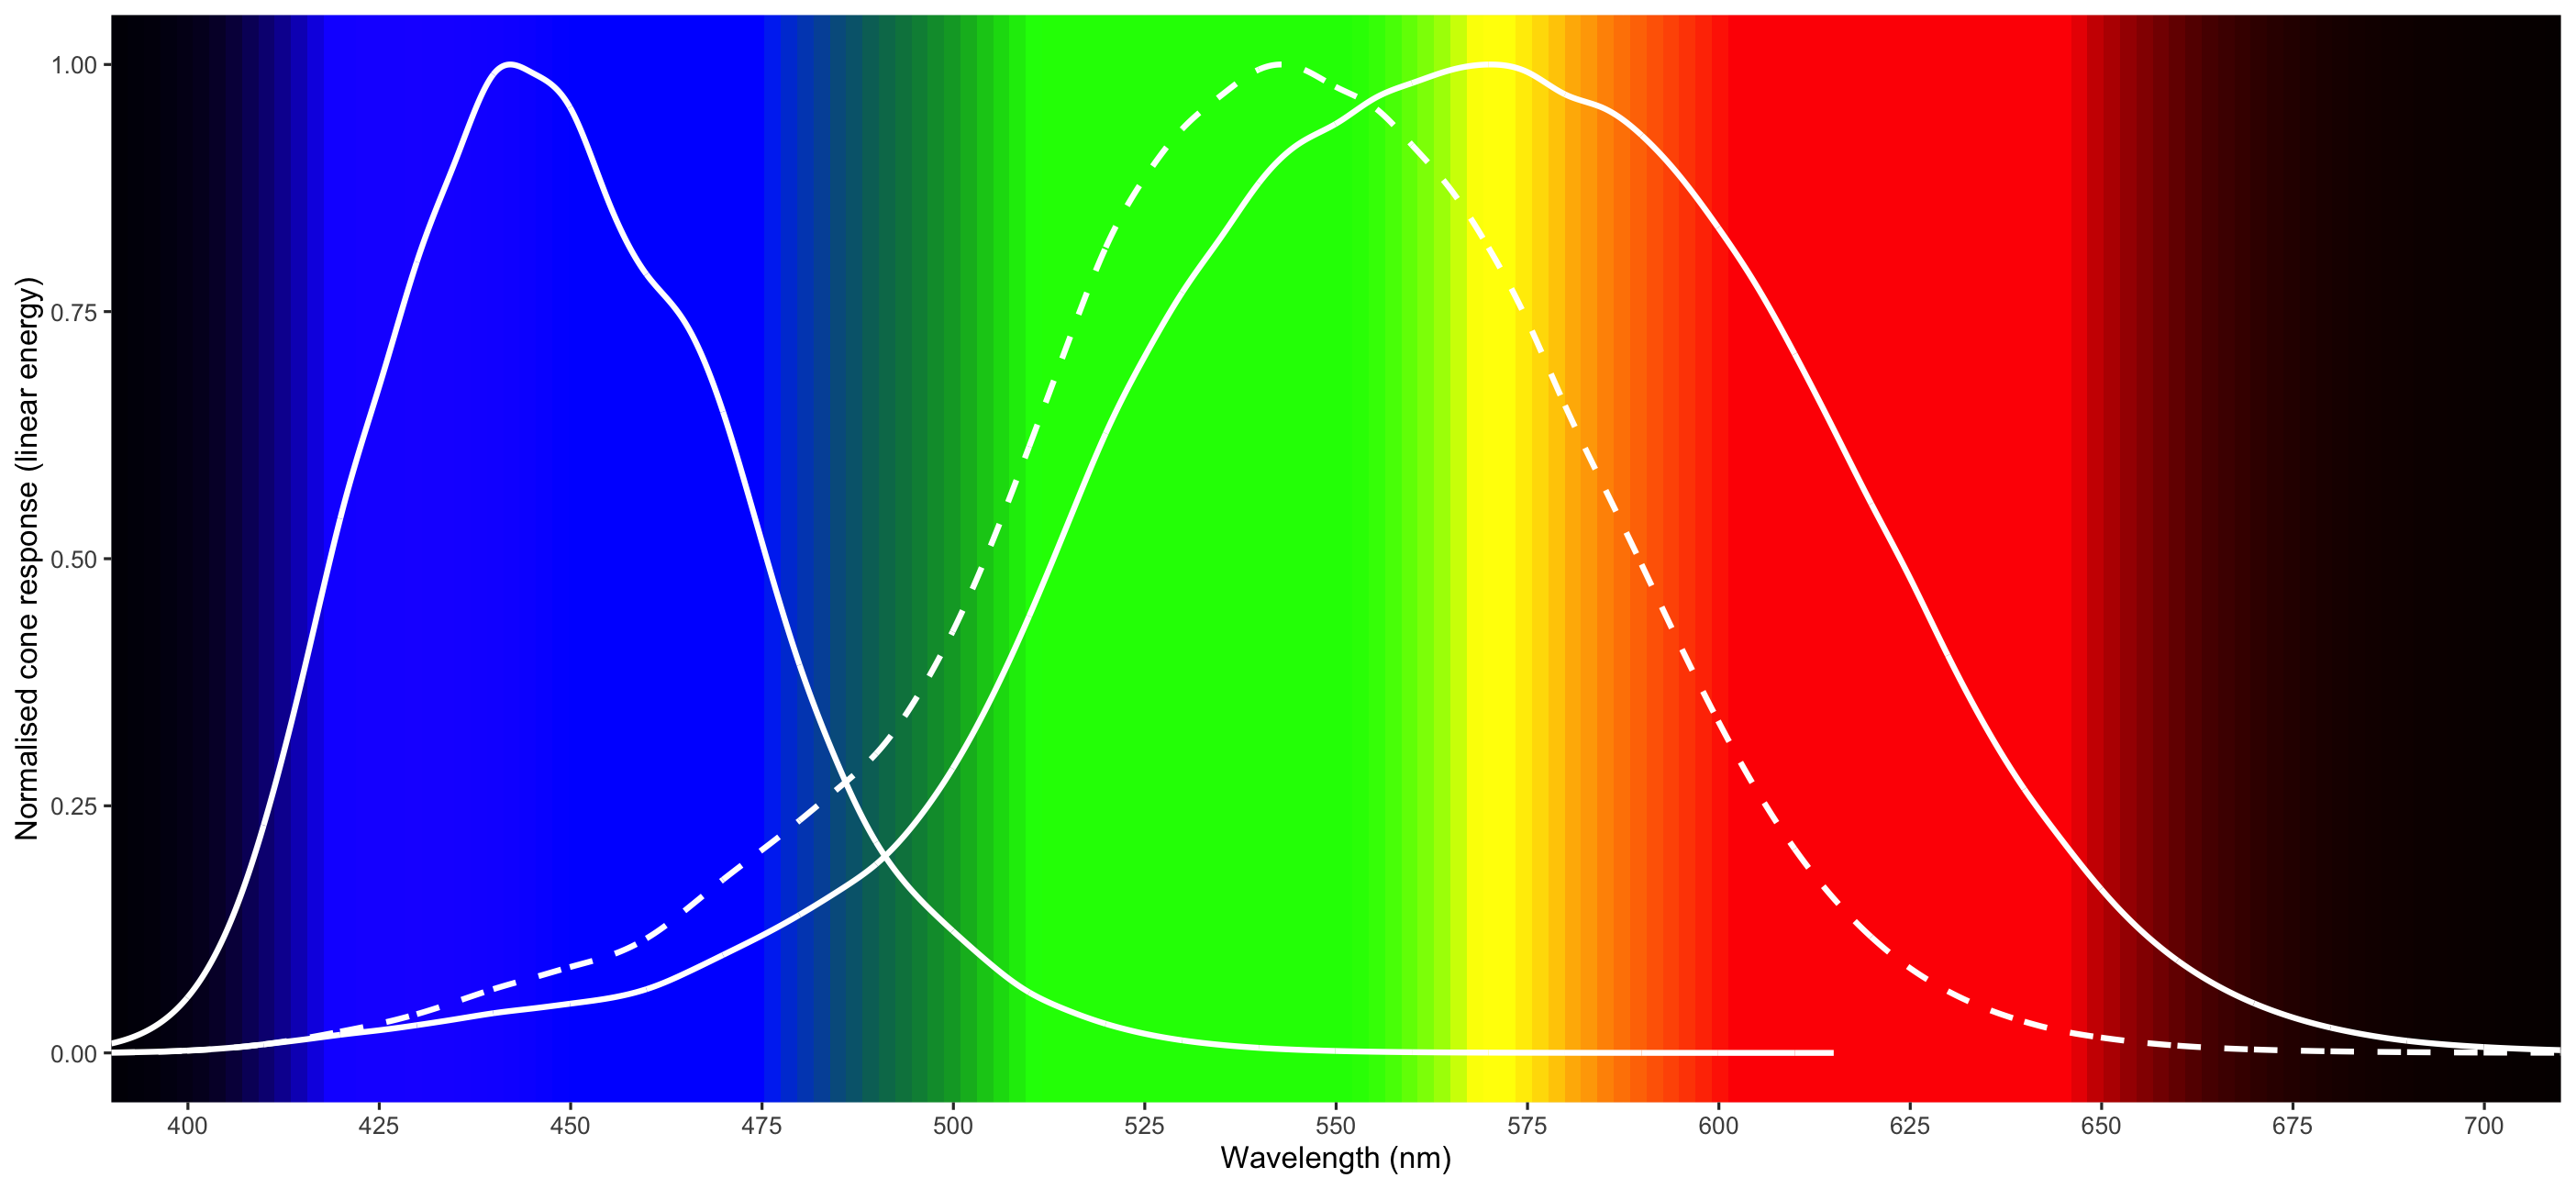
No S cone = Tritanopia (Less "Blue")
Colourblindness impacts everyday design
Without those cones, some colours look the same
Colourblindness impacts everyday design
Without those cones, some colours look the same
This is why traffic lights have position markings, instead of just the same position changing colour.
Normal Traffic Light
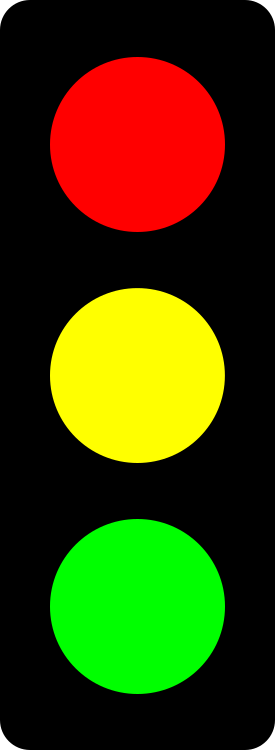
Traffic Light (Protan)
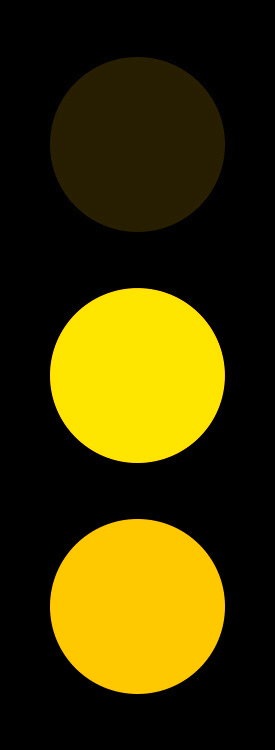
Traffic Light (Deutan)
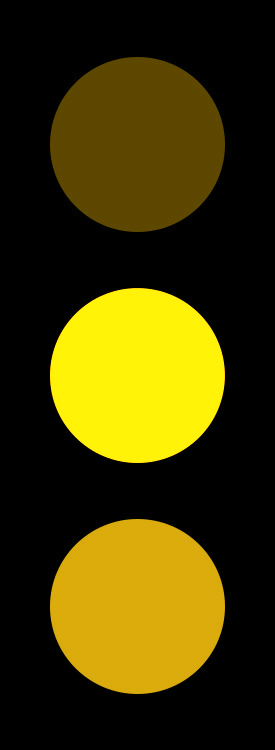
Traffic Light (Tritan)

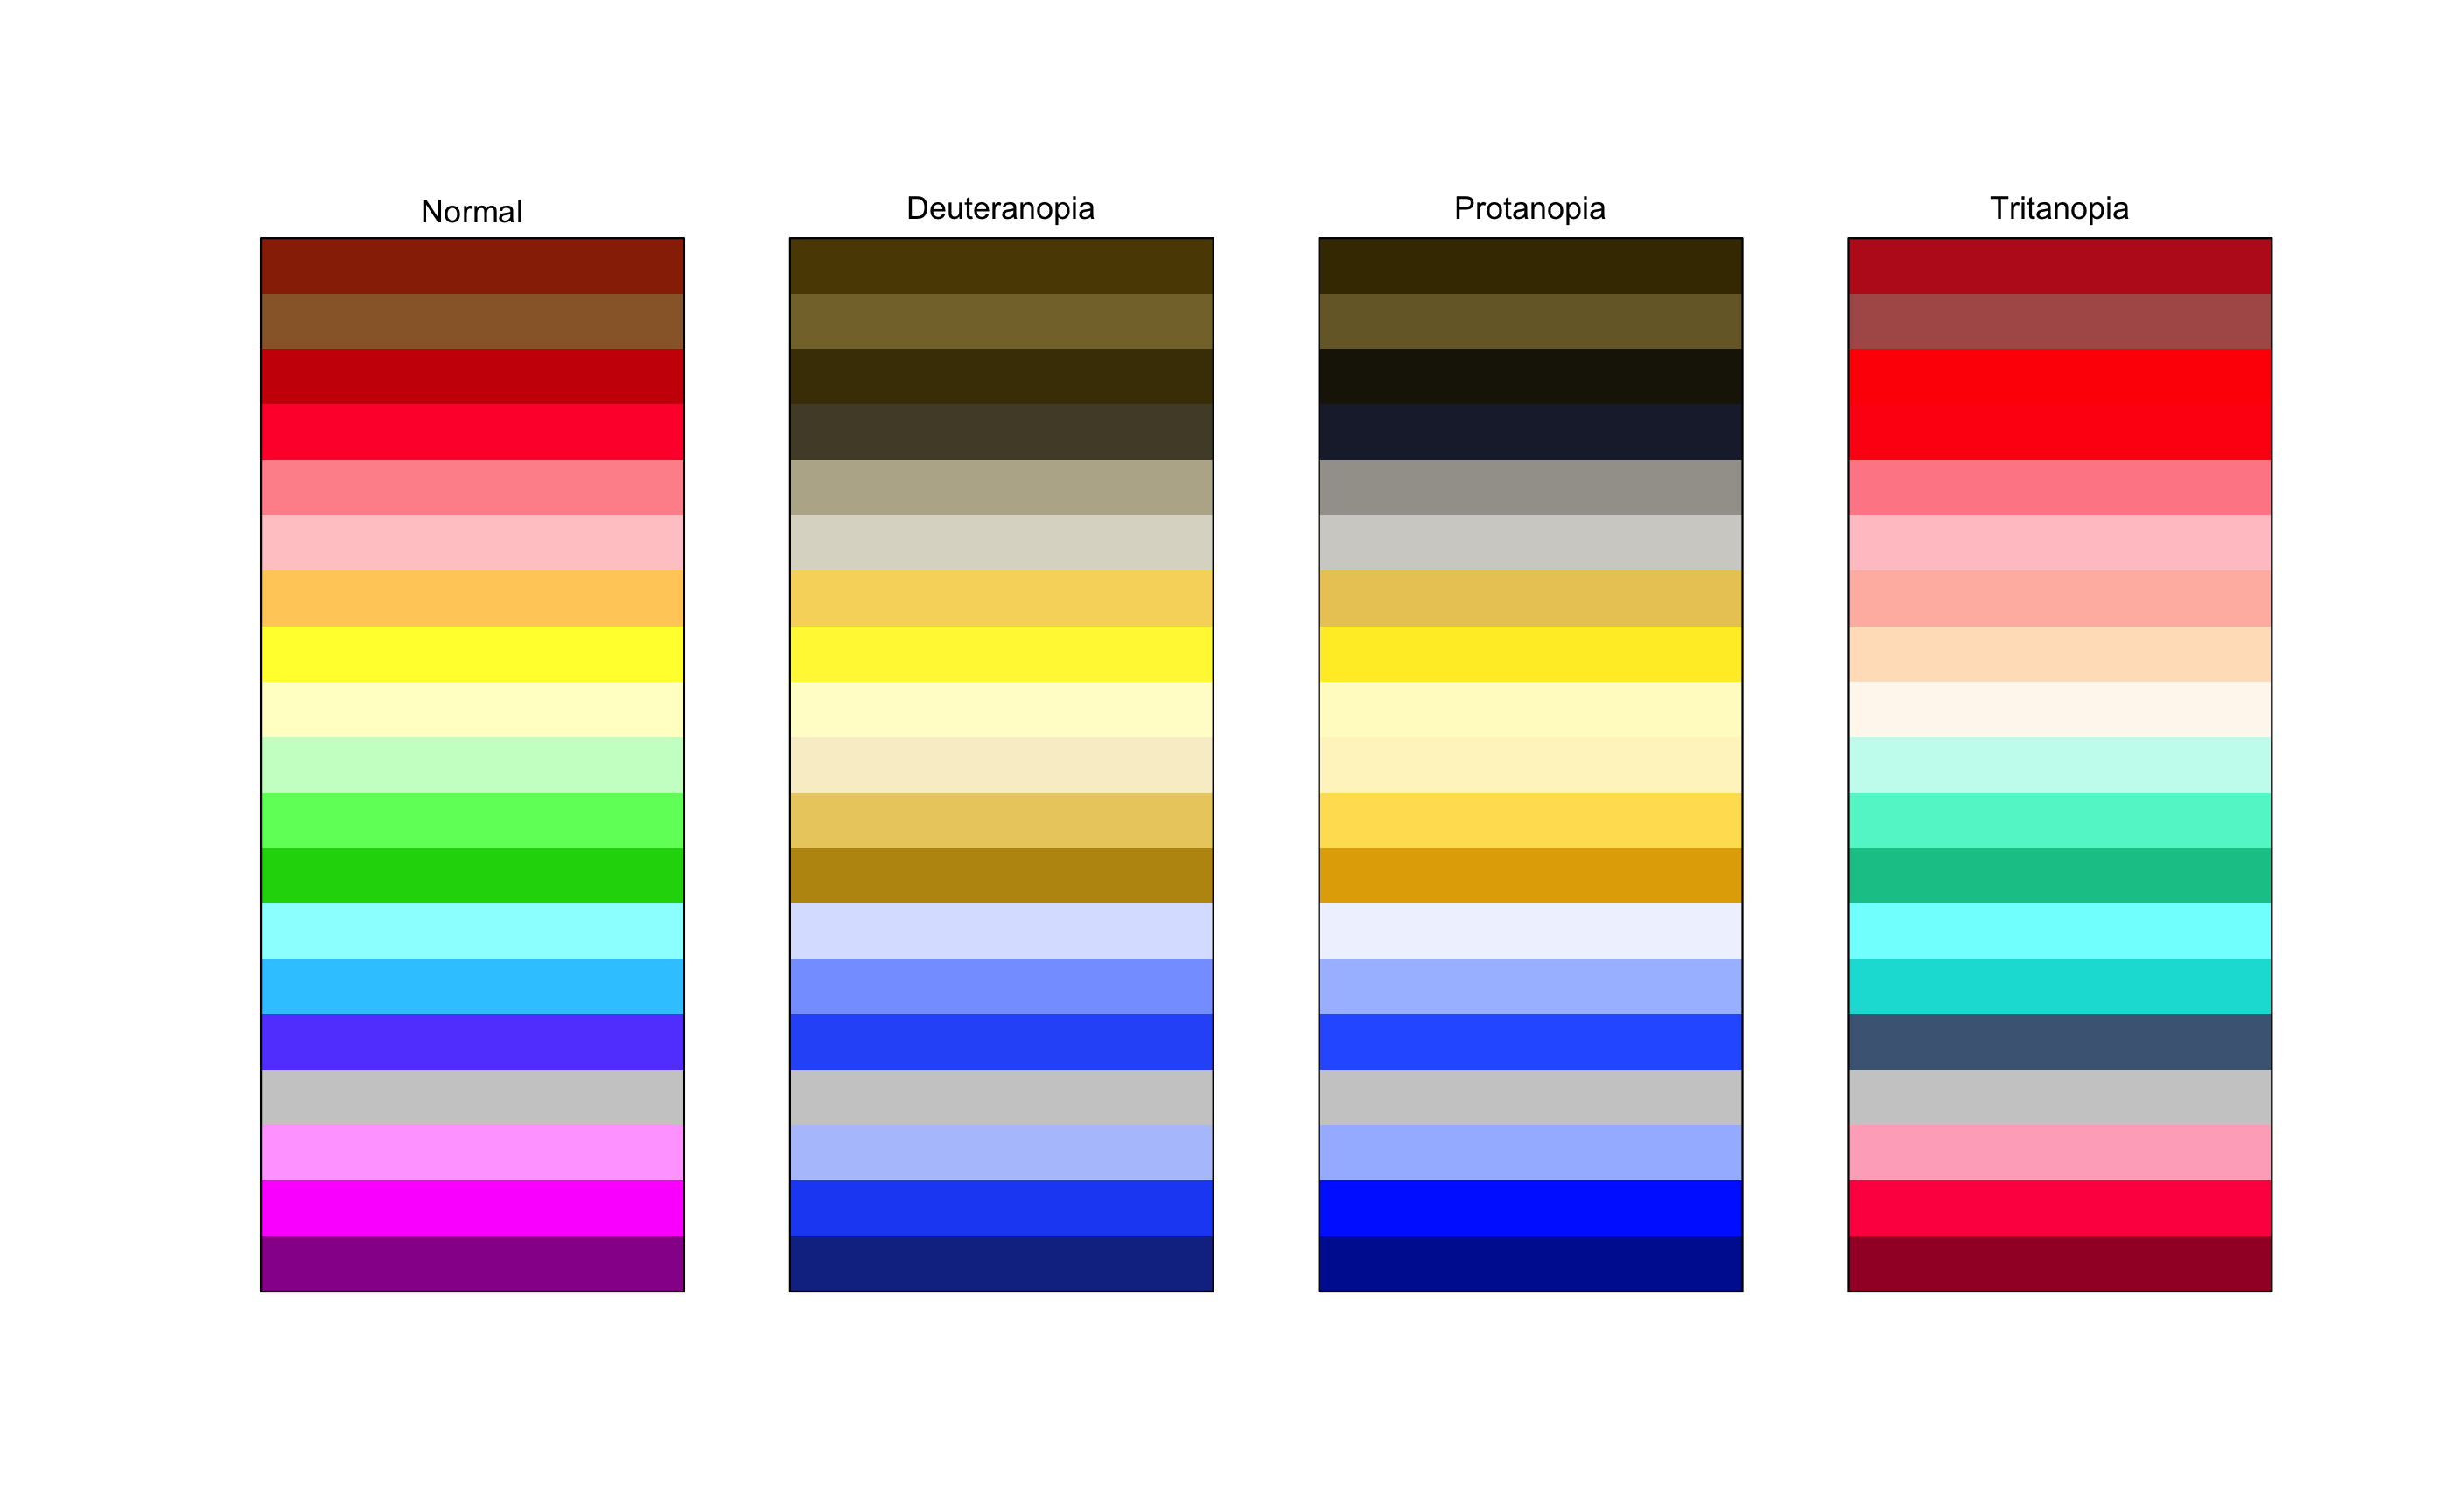
Some of these colours look very similar!
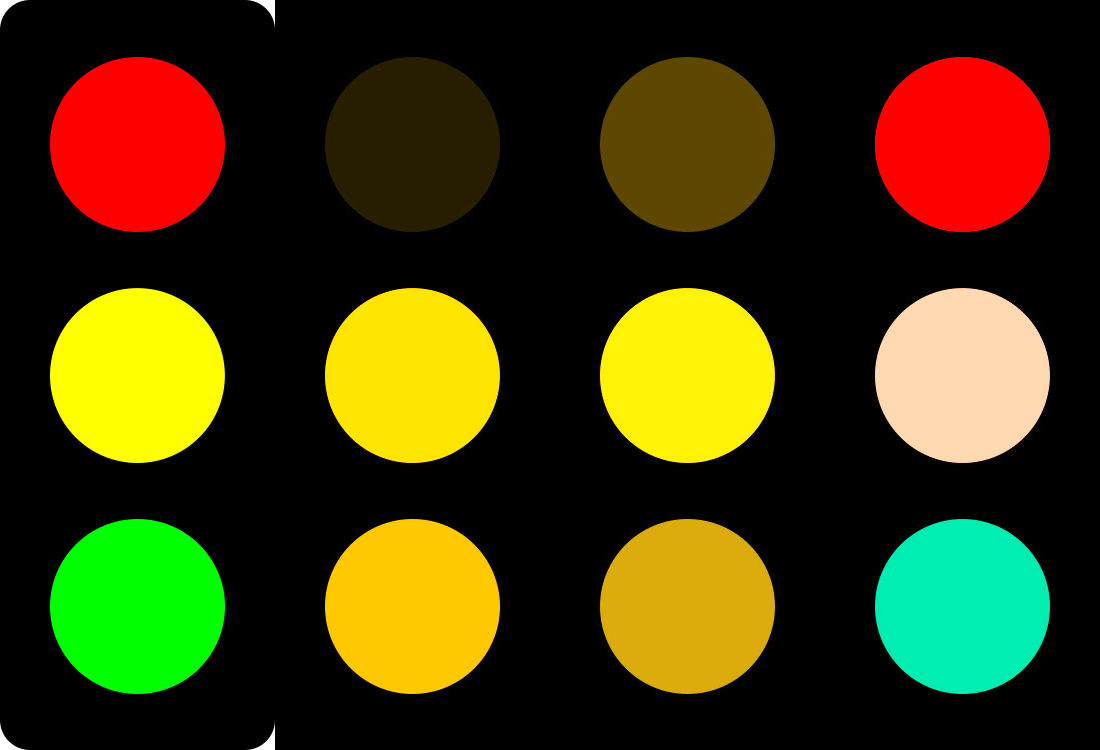
gif of good traffic light for different vision
vs
gif of bad traffic light with different vision
Colourblindness key points
- We perceive colour using the cones in our eyes
- Some people don't have certain cones, or reduced capacity in those
- This means some colours cannot be distinguished by those with colourblindness
- We need to be careful how we present colour, and what colours we present.
Tools for testing how well your plot stands up to colourblindness?
- We can transform colours into approximations of colourblindness
- Many tools exist for exploring colourblindness
- We'll mostly be exploring the R package,
colorspace
Tools for testing how well your plot stands up to colourblindness?
colorspace:protan(),deutan(),tritan()transform colours.
# Just rainbowrainbow(5)## [1] "#FF0000" "#CCFF00" "#00FF66" "#0066FF" "#CC00FF"# Rainbow into protanrainbow(5) %>% protan()## [1] "#261D00" "#FFDF00" "#F7D25F" "#3769FF" "#0030FF"How to test how well your plot stands up to colourblindness?
rainbow(19) %>% protan() %>% swatchplot()
How to test how well your plot stands up to colourblindness?
The prismatic package provides check_color_blindness:
rainbow(19) %>% check_color_blindness()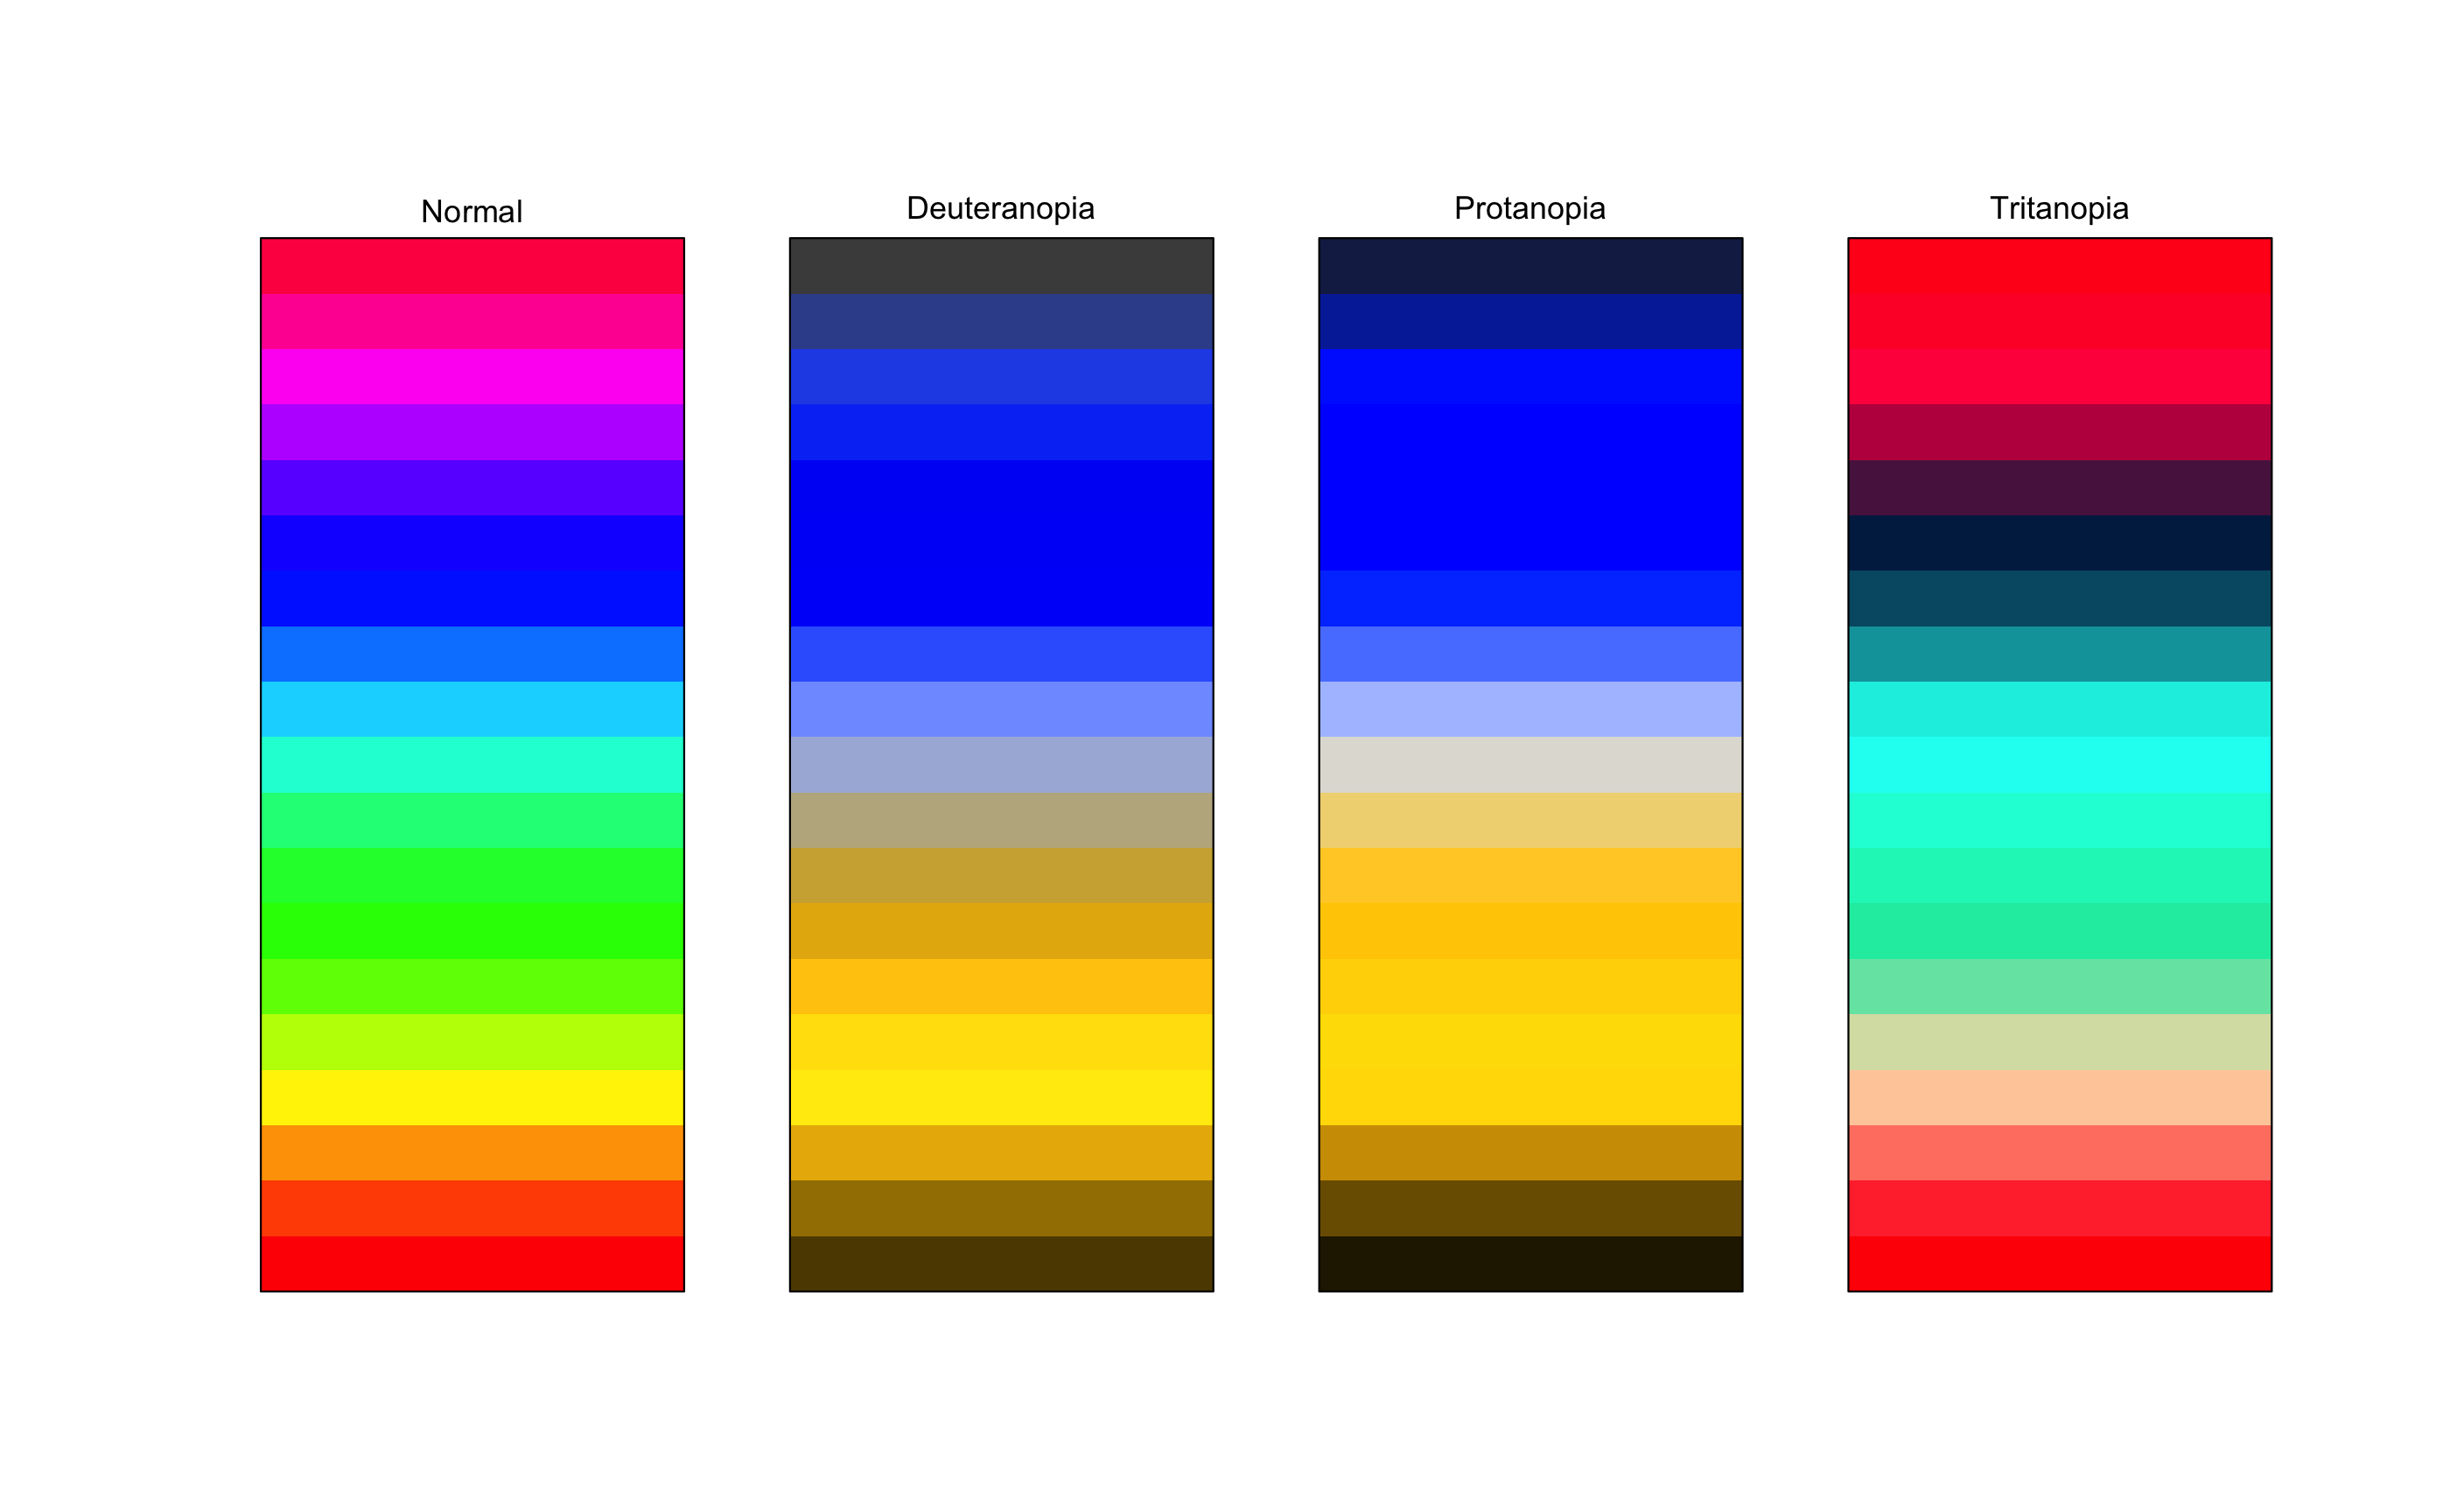
What if your plot is an image already?
colorspaceprovides a "Colour Vision Deficiency (CVD) Emulator" -cvd_emulator.- This takes in a JPG / PNG
- Let's explore what this original image from BoM looks like:
cvd_emulator("imgs/bom-heat-map.png")Original image

Protan image (No Red Cone)

Deutan image (No Green Cone)

Tritan image (No Blue Cone)
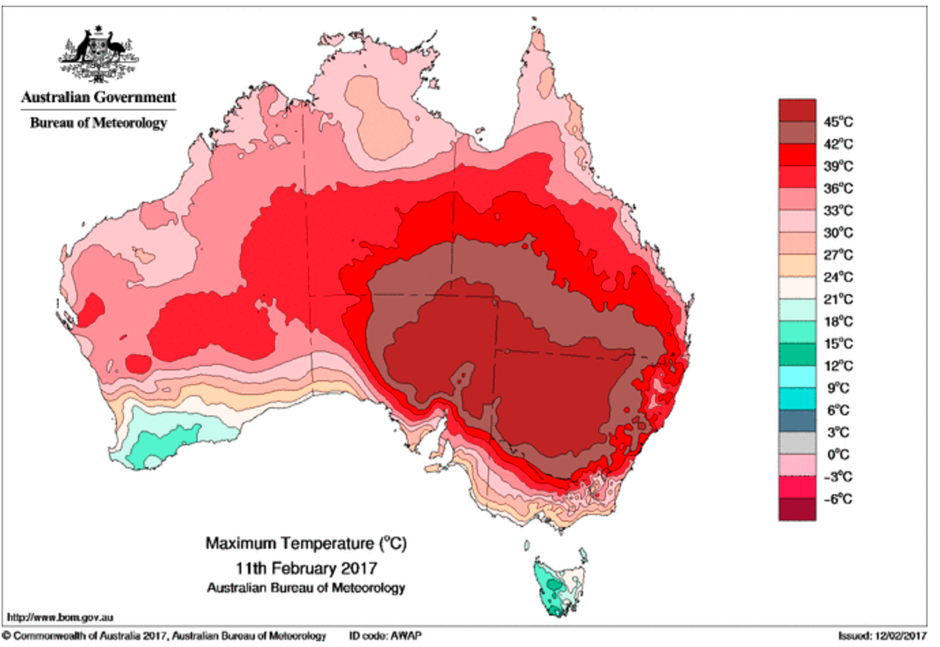
Greyscale image

- What is a vocabulary around colour?
- How do I assess colour?
- How do I create new colour palettes?
Describing colour in graphics

- Something about this grayscale plot was interesting
- It looped back on itself in places
- That was the colour ... saturation?
- Colour...brightness?
- Colour...depth?
Describing colour in graphics
- There is a wide vocab that we can use to discuss colour.
- We can describe any colour using the different values of red, green, and blue.
- Remember the red, green, and blue cones?
Describing colour in graphics
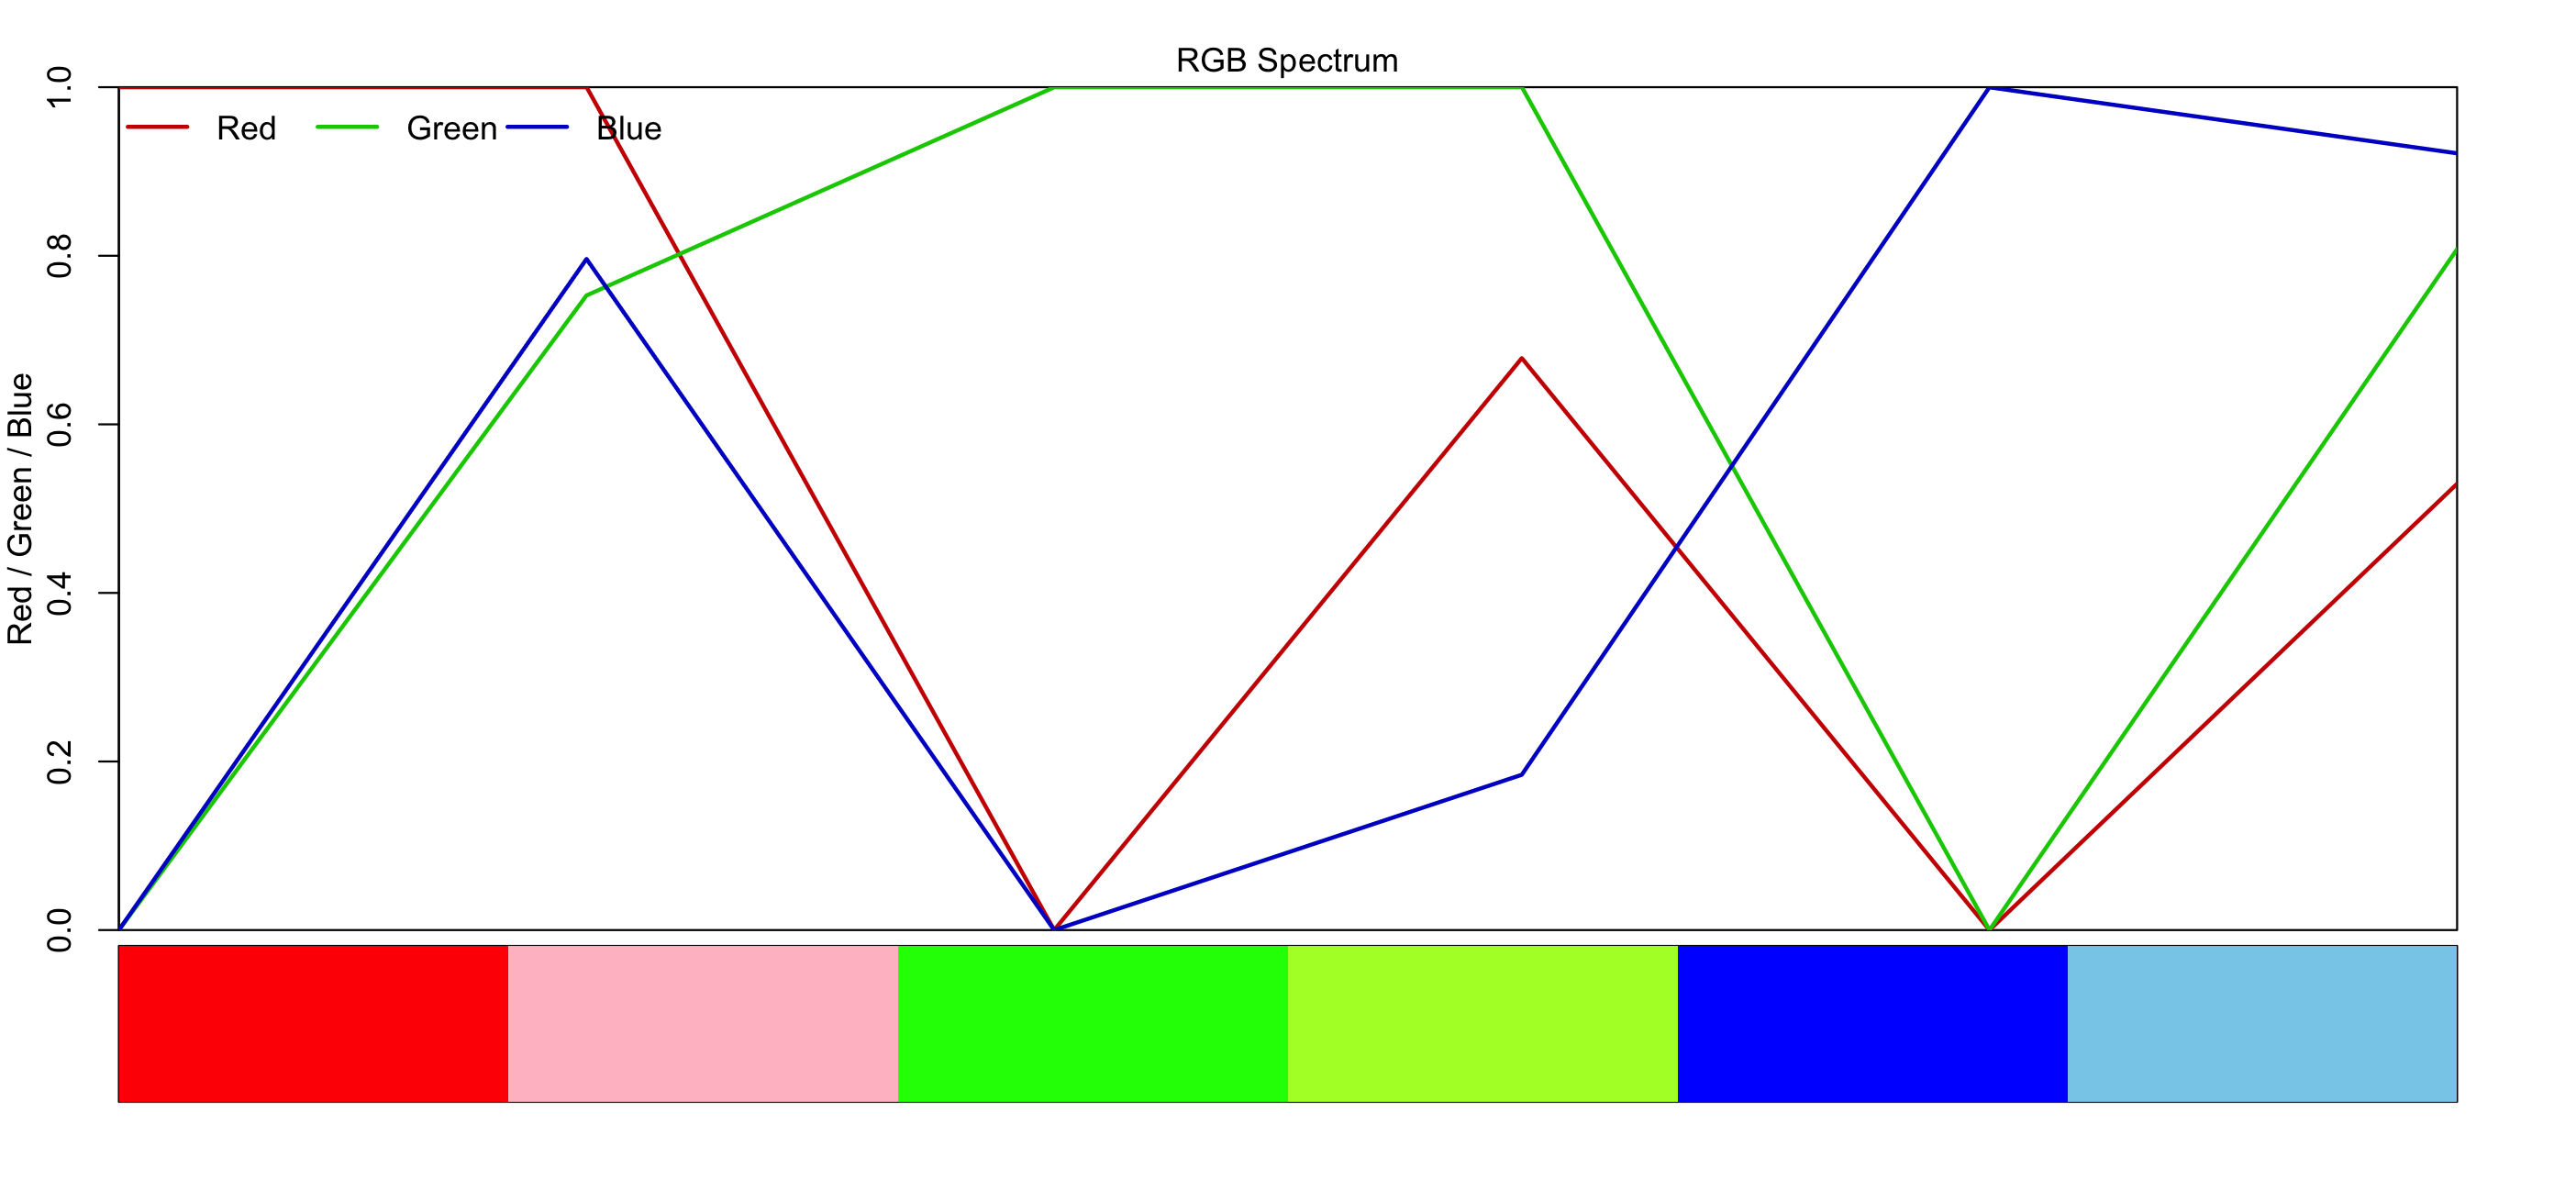
Describing colour in graphics

- But in looking at the BoM plot, it doesn't really help us to say: "We need 50% more red, and reduce the intensity of green".
- It is hard for us to really imagine and predict without a lot of training
- Is there another way to describe the colour?
Yes: Hue, Chroma, Luminance
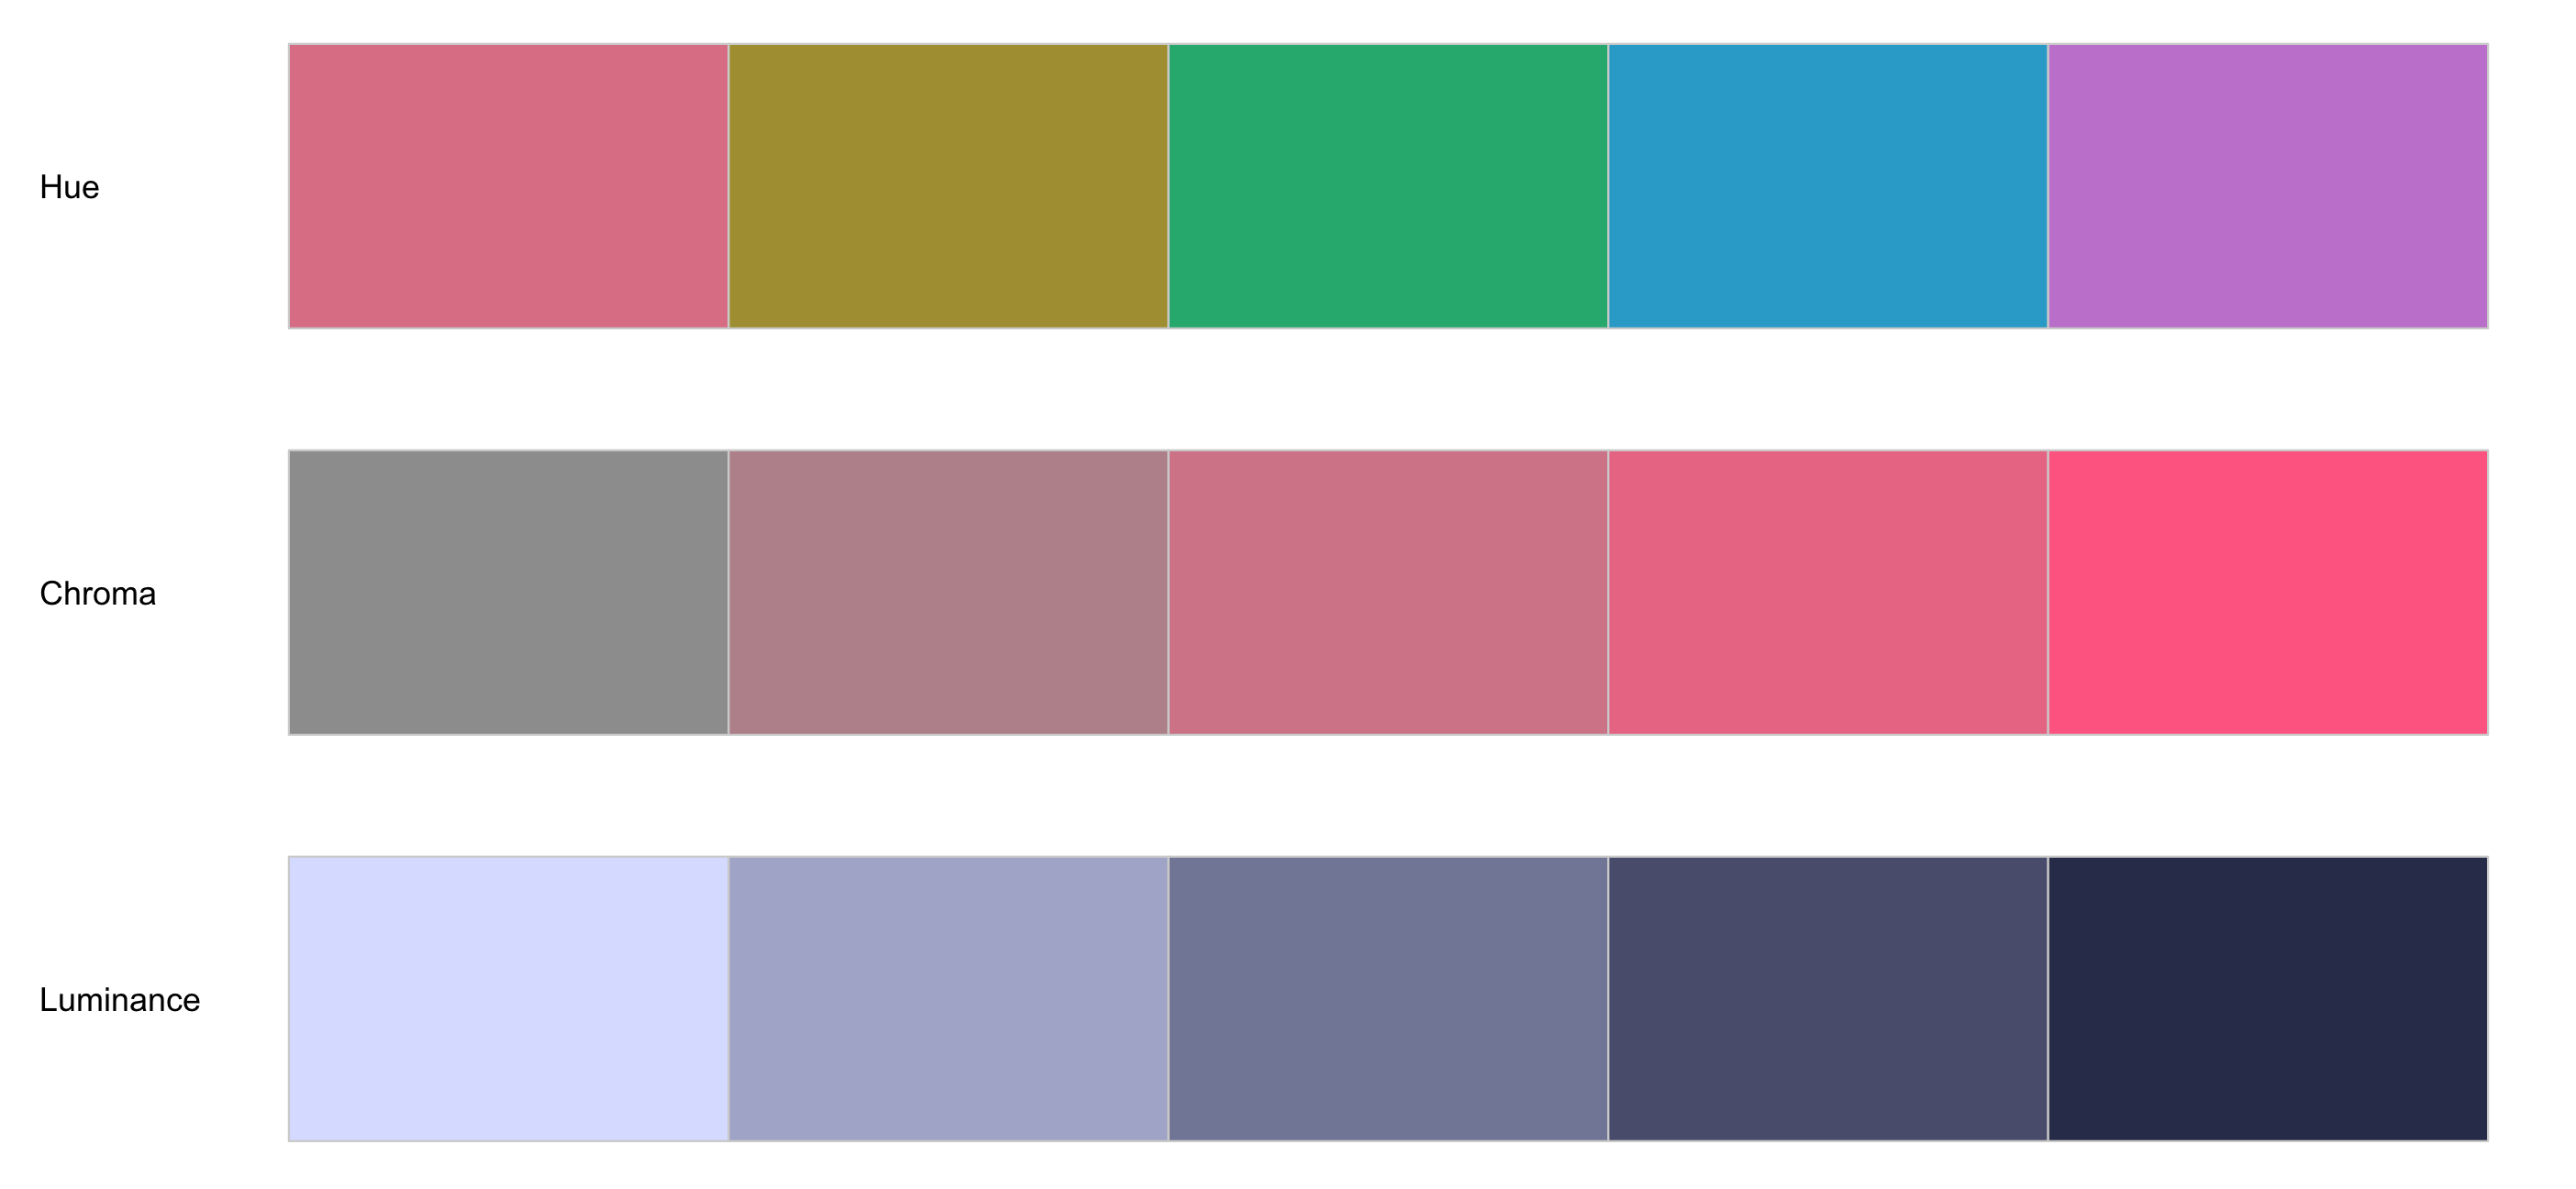
These go by other names, and are just one of a set of many different colour representations (HSV, CIELAB, … ), and the literature on colourspace is wide and vast. These allow us to explore and explain colour in a way that makes sense to human.
These are human readable ways to describe colour, but ultimately get expressed into terms of RGB.
Colorspace
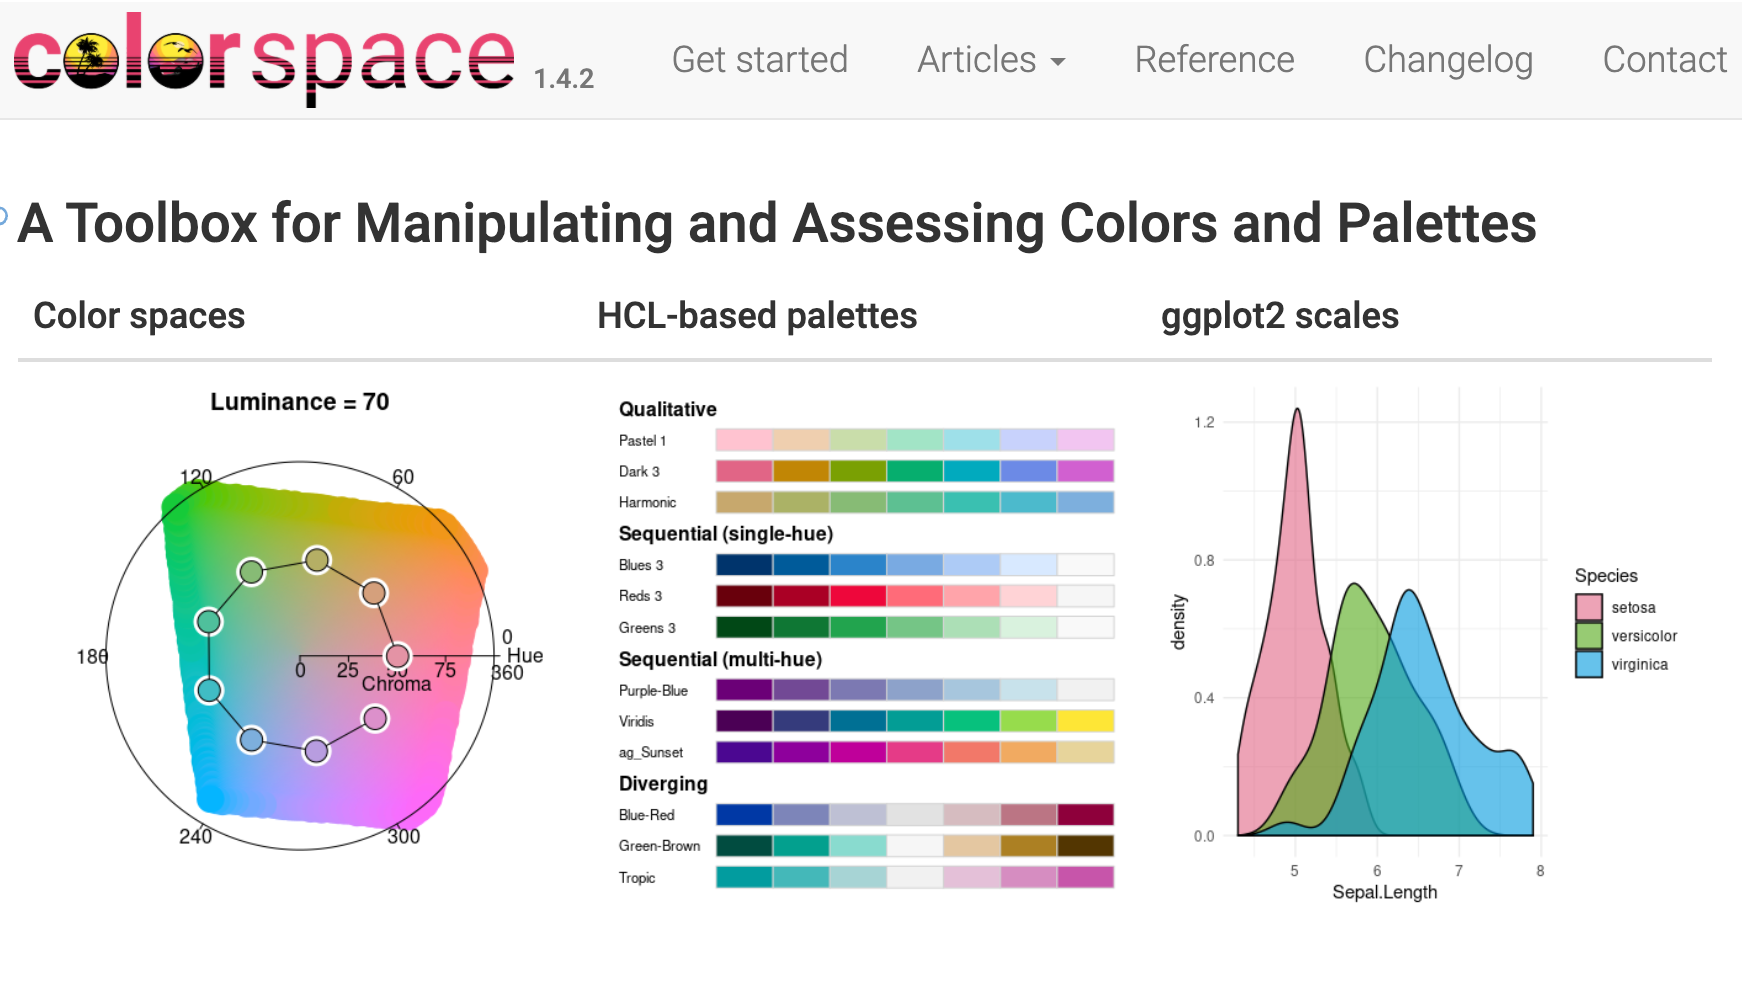

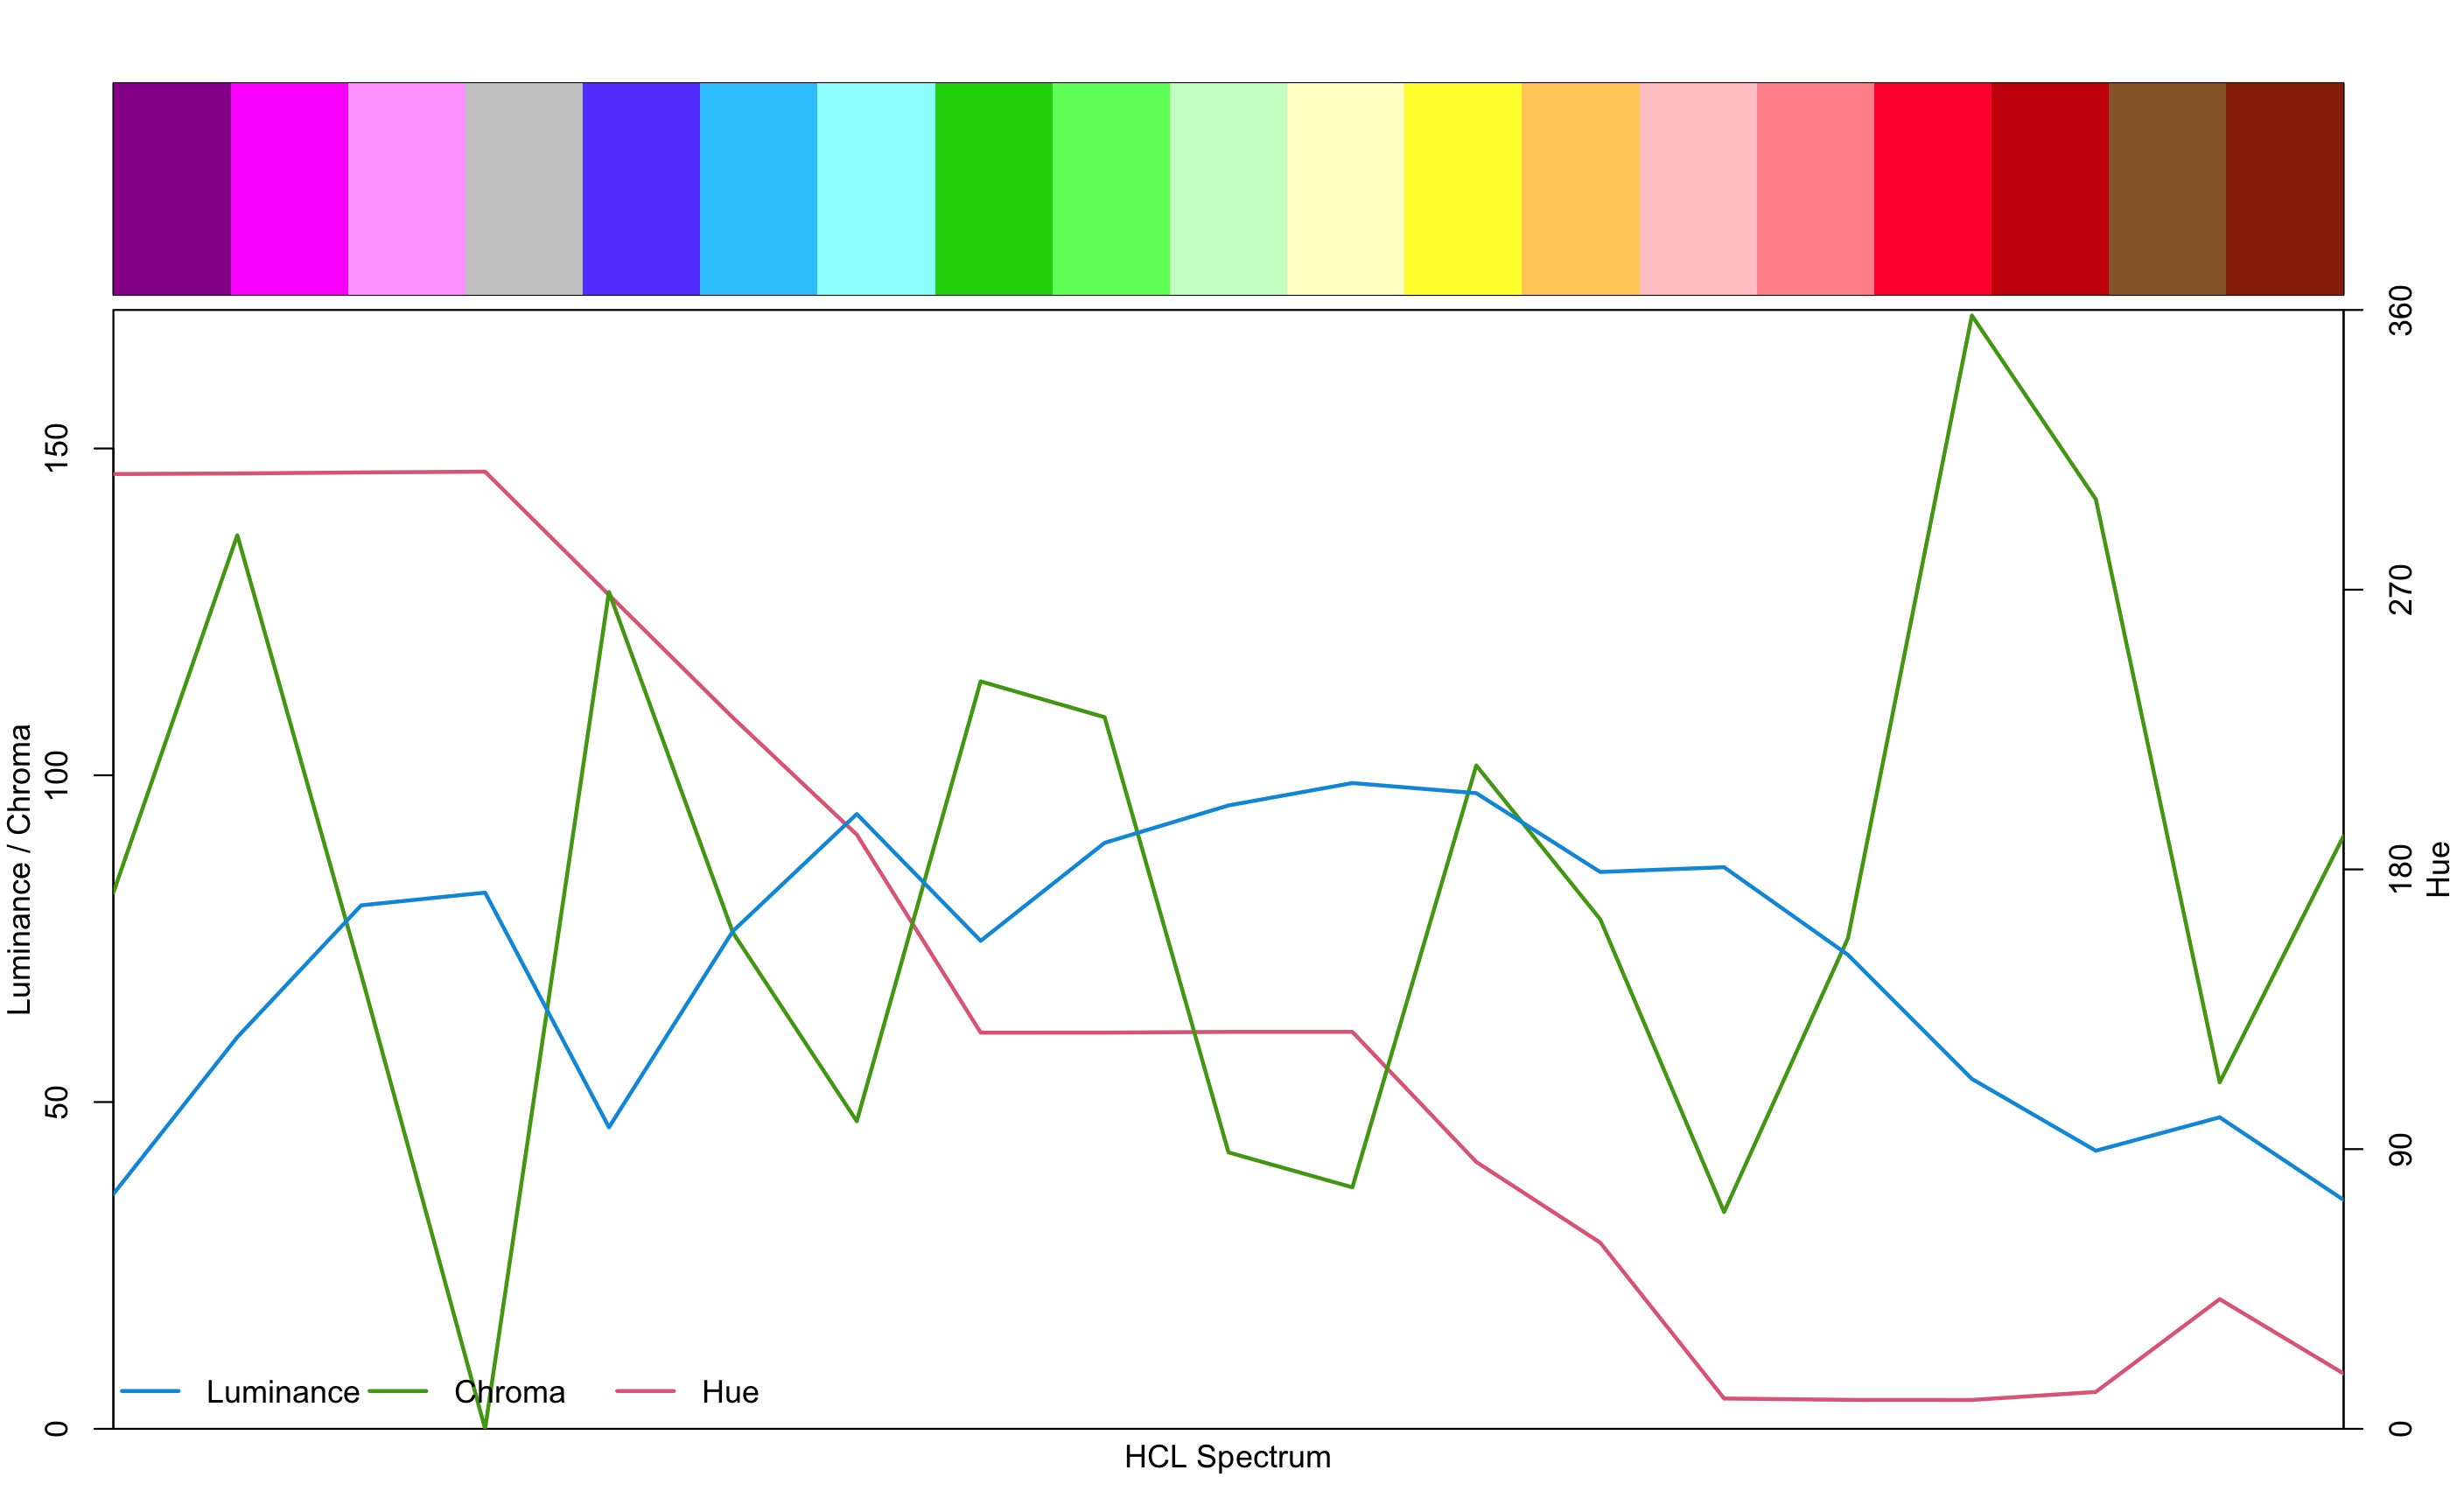
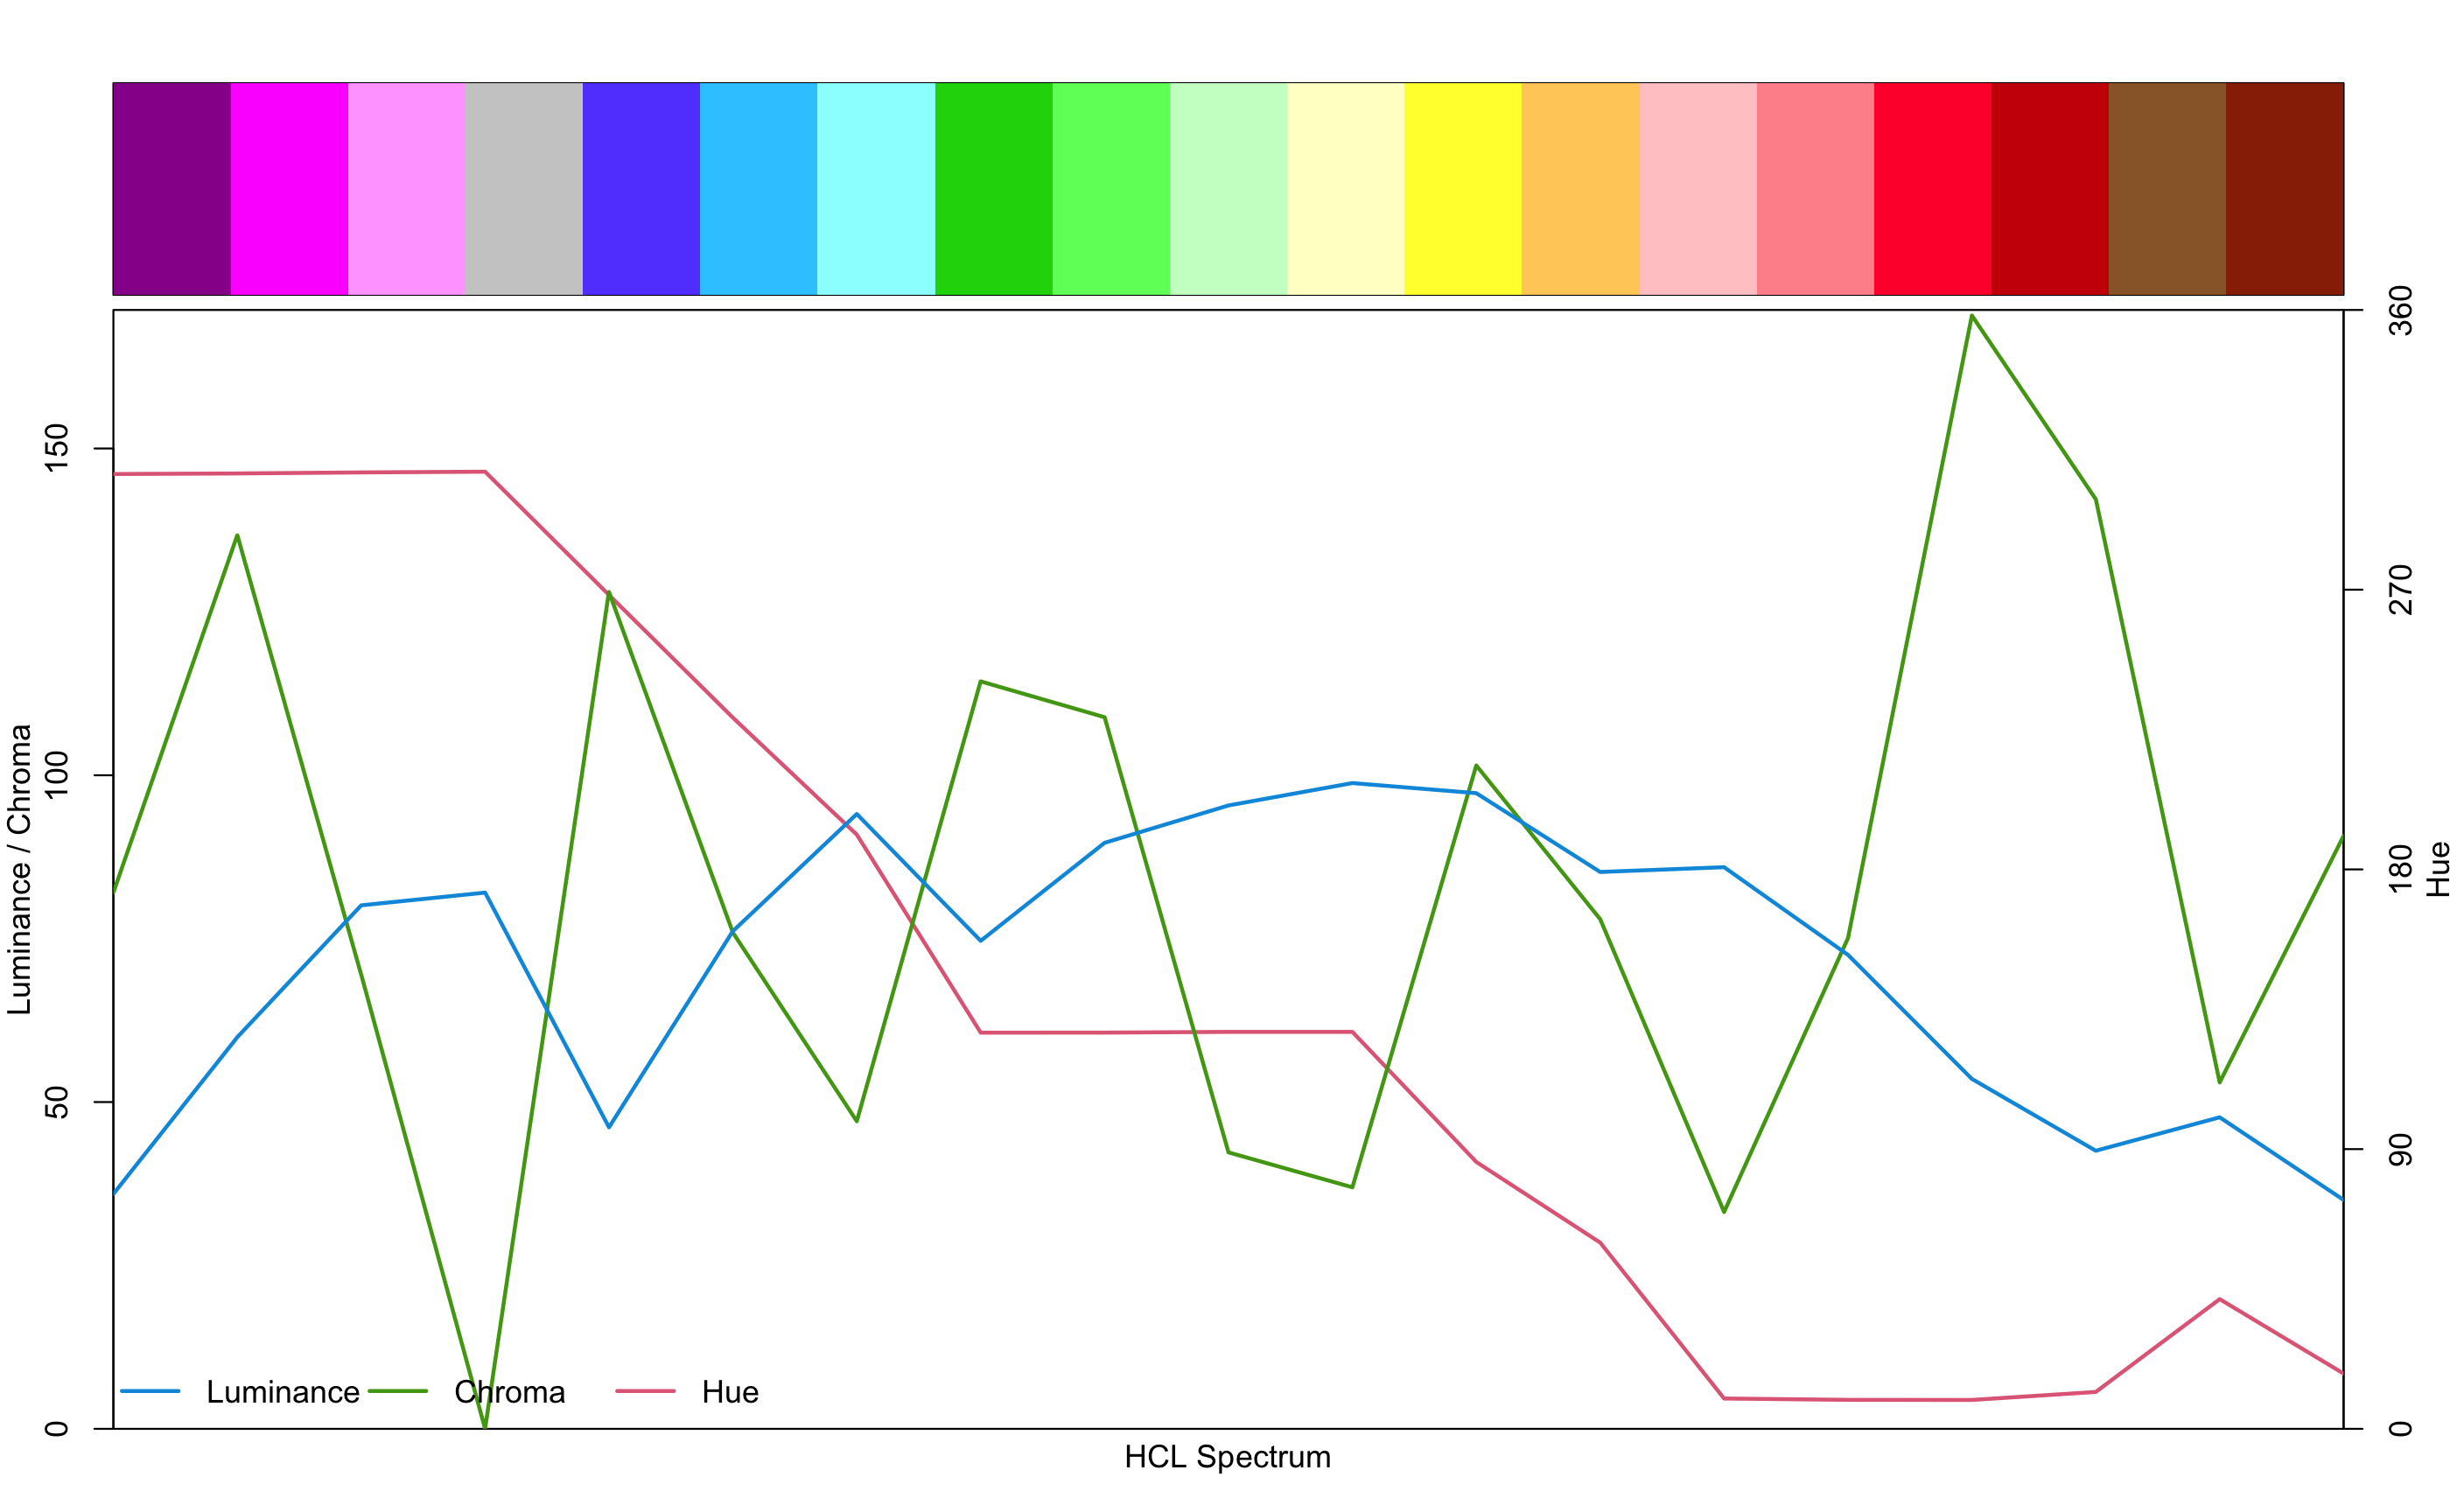
Describing our previous maps in terms of hue, chroma, luminance
- Using
colorspaceto explore colour palettes - We can explore some colour palettes using HCL, with the
specplotfunction fromcolorspace. - We can take our palette and plot it along these dimensions
HCL of BoM plot palette
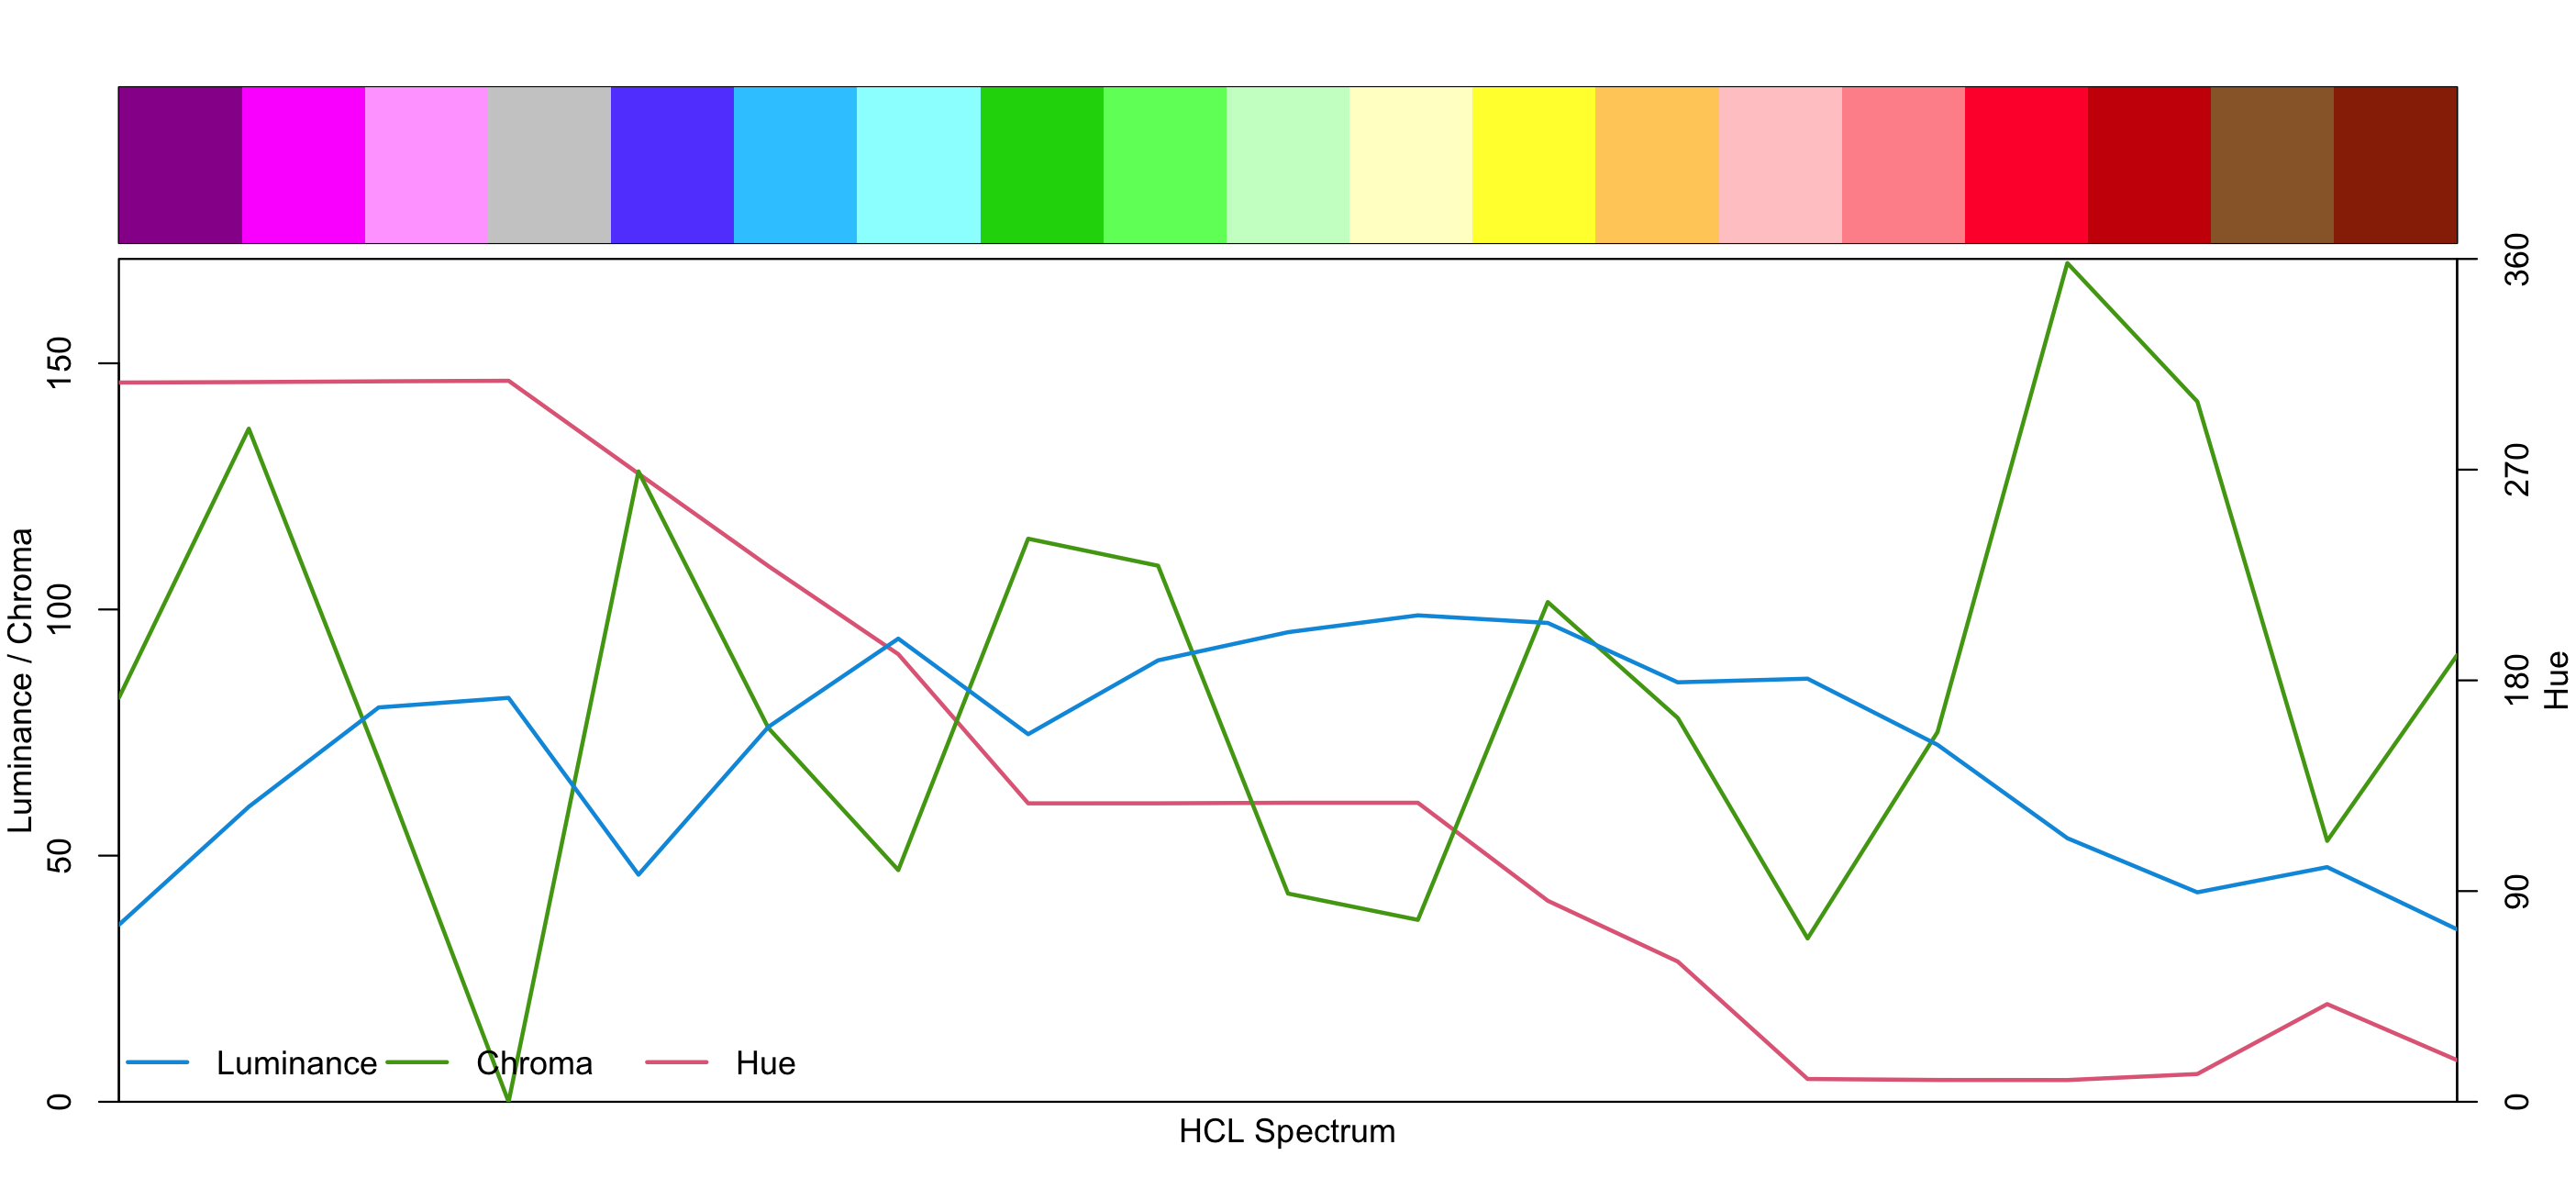
I have the nice colours used in the Australian heat data here, which we can view with swatchplot from colorspace, or show_cols from scales
Design decisions when choosing colour
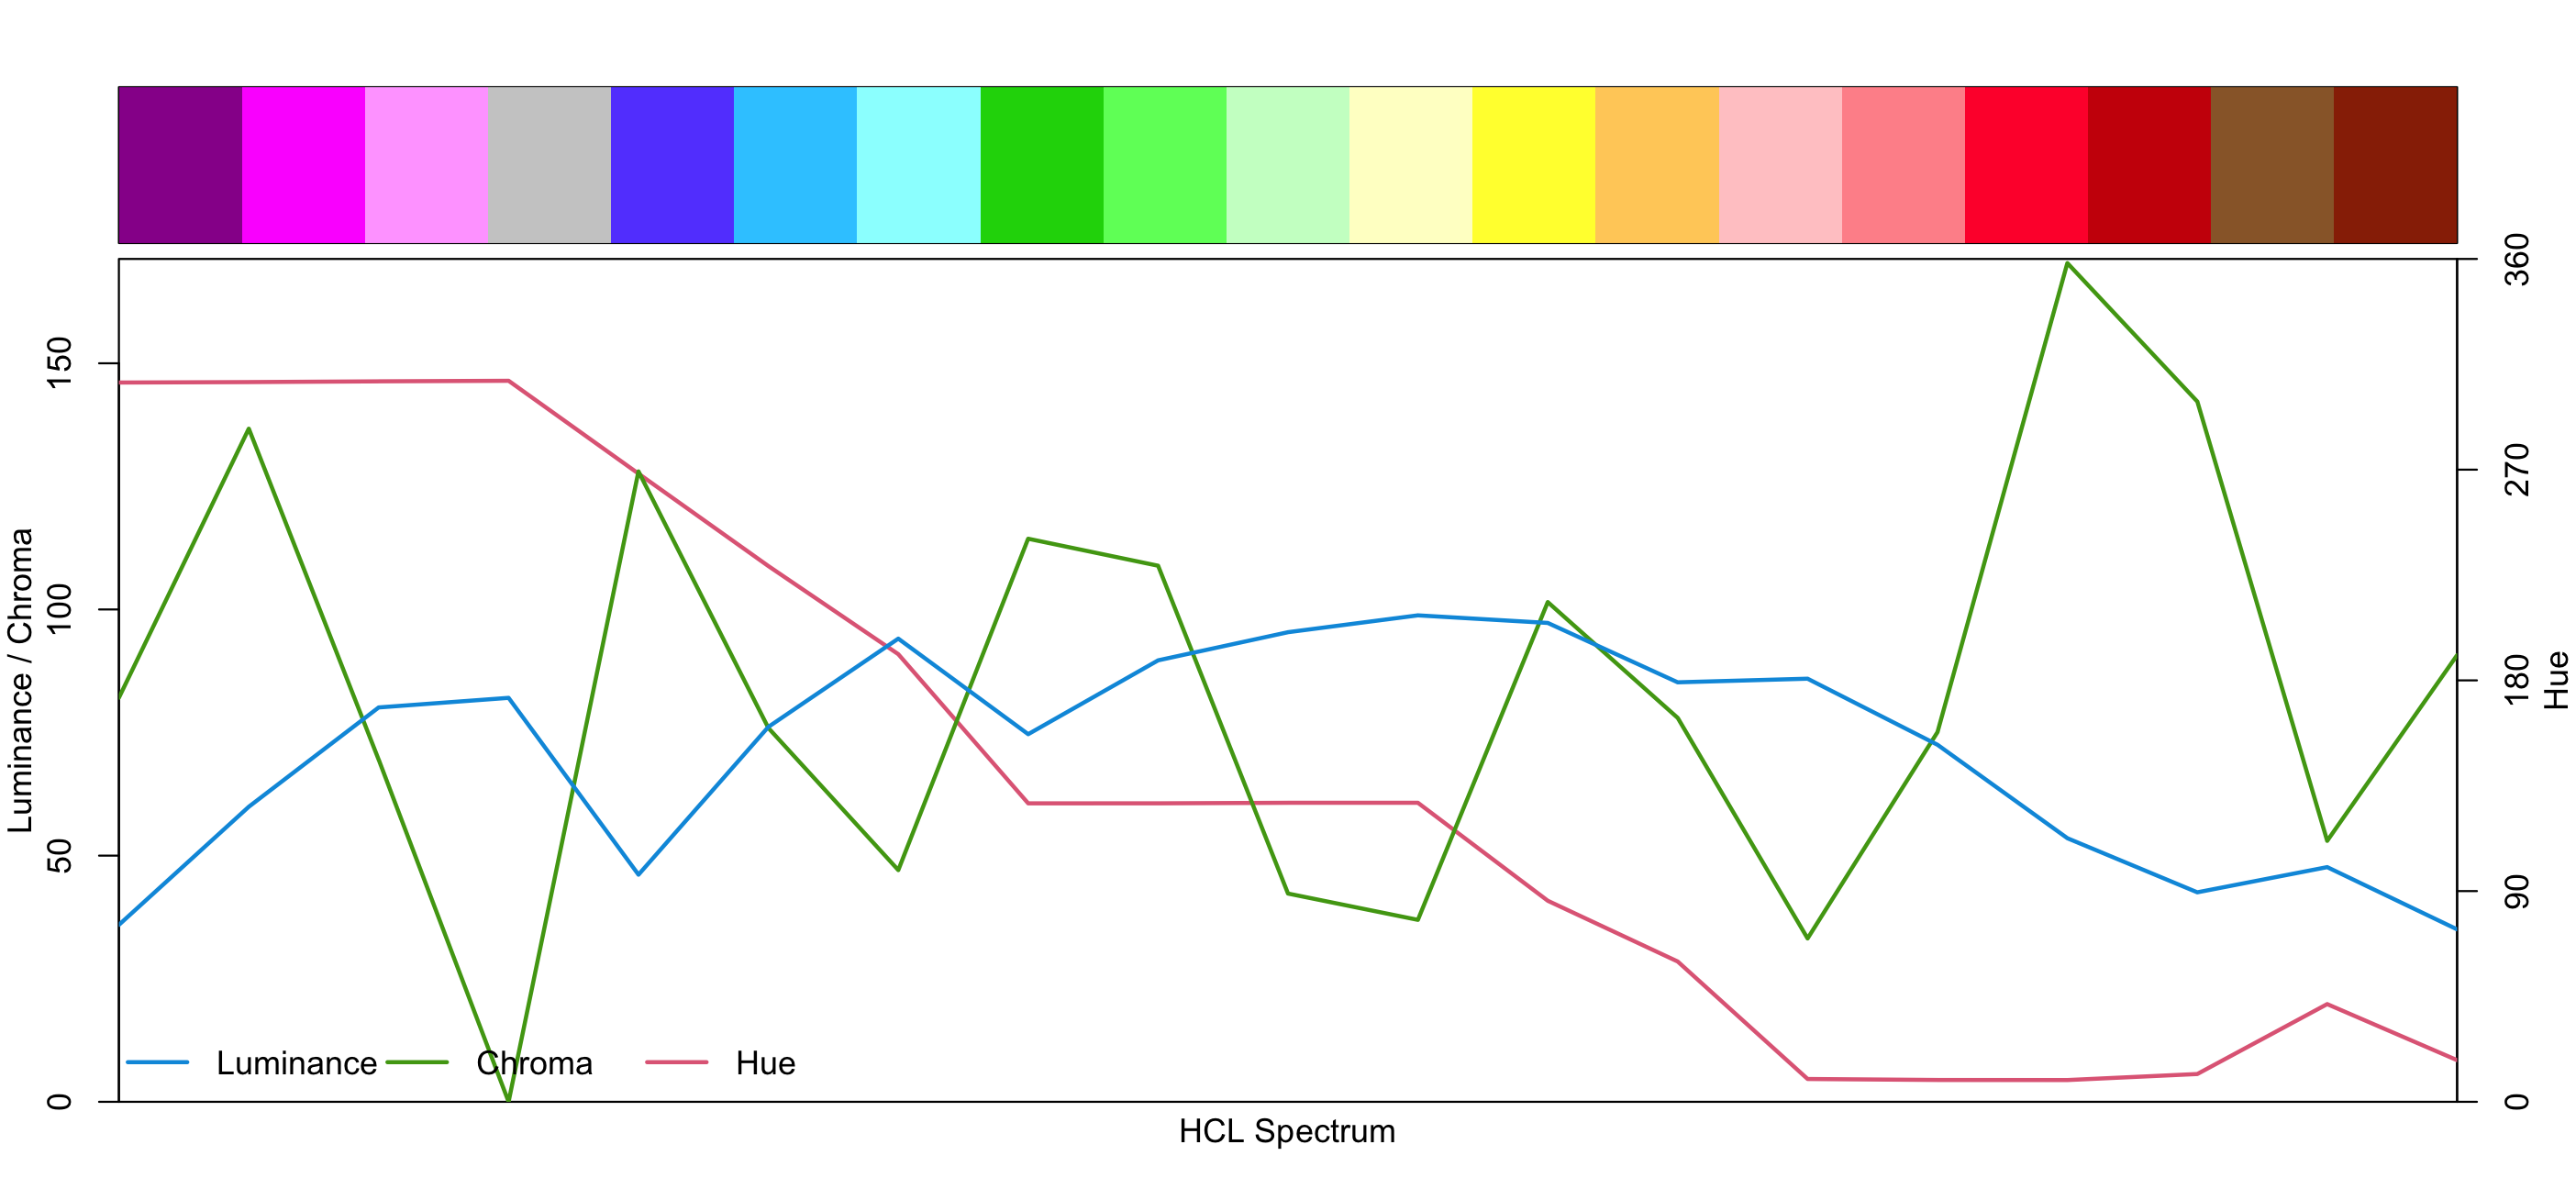
- Colours change hue a lot
- Expectation: As temperature increased, other parameters increase?
- Expectation: one unit step in the palette produces a constant perceptual change in colour (perceptually uniform).
- Doesn't seem to be the case
- Wrong type of palette?
Types of palettes
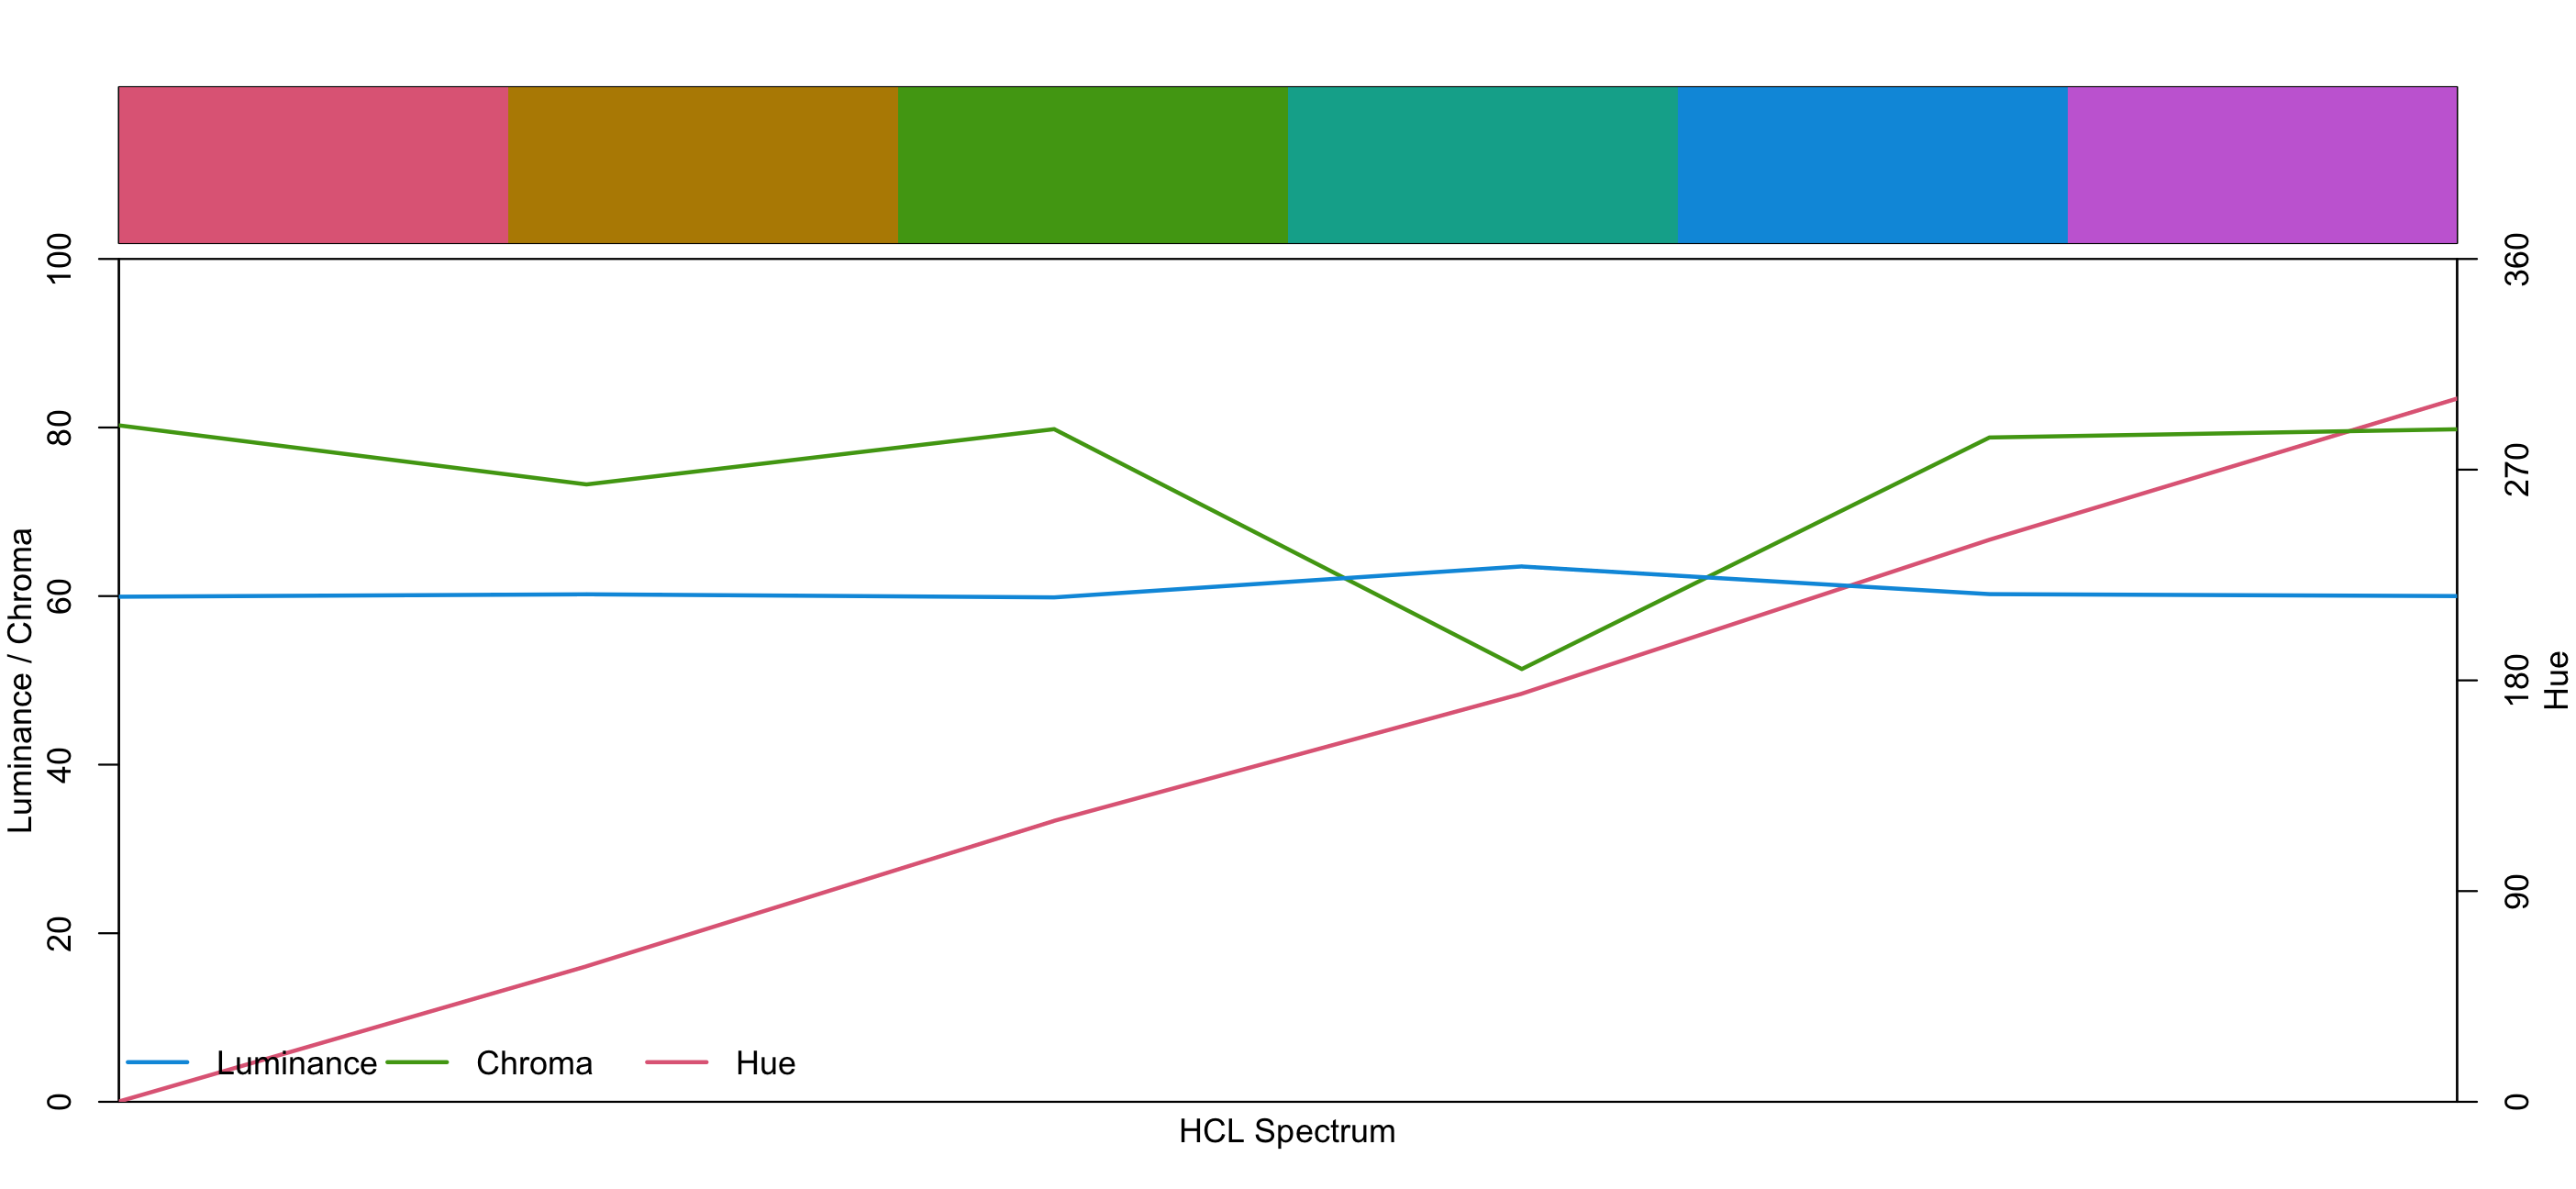
Qualitative: For coding categorical information, i.e., where no particular ordering of categories is available and every color should receive the same perceptual weight.
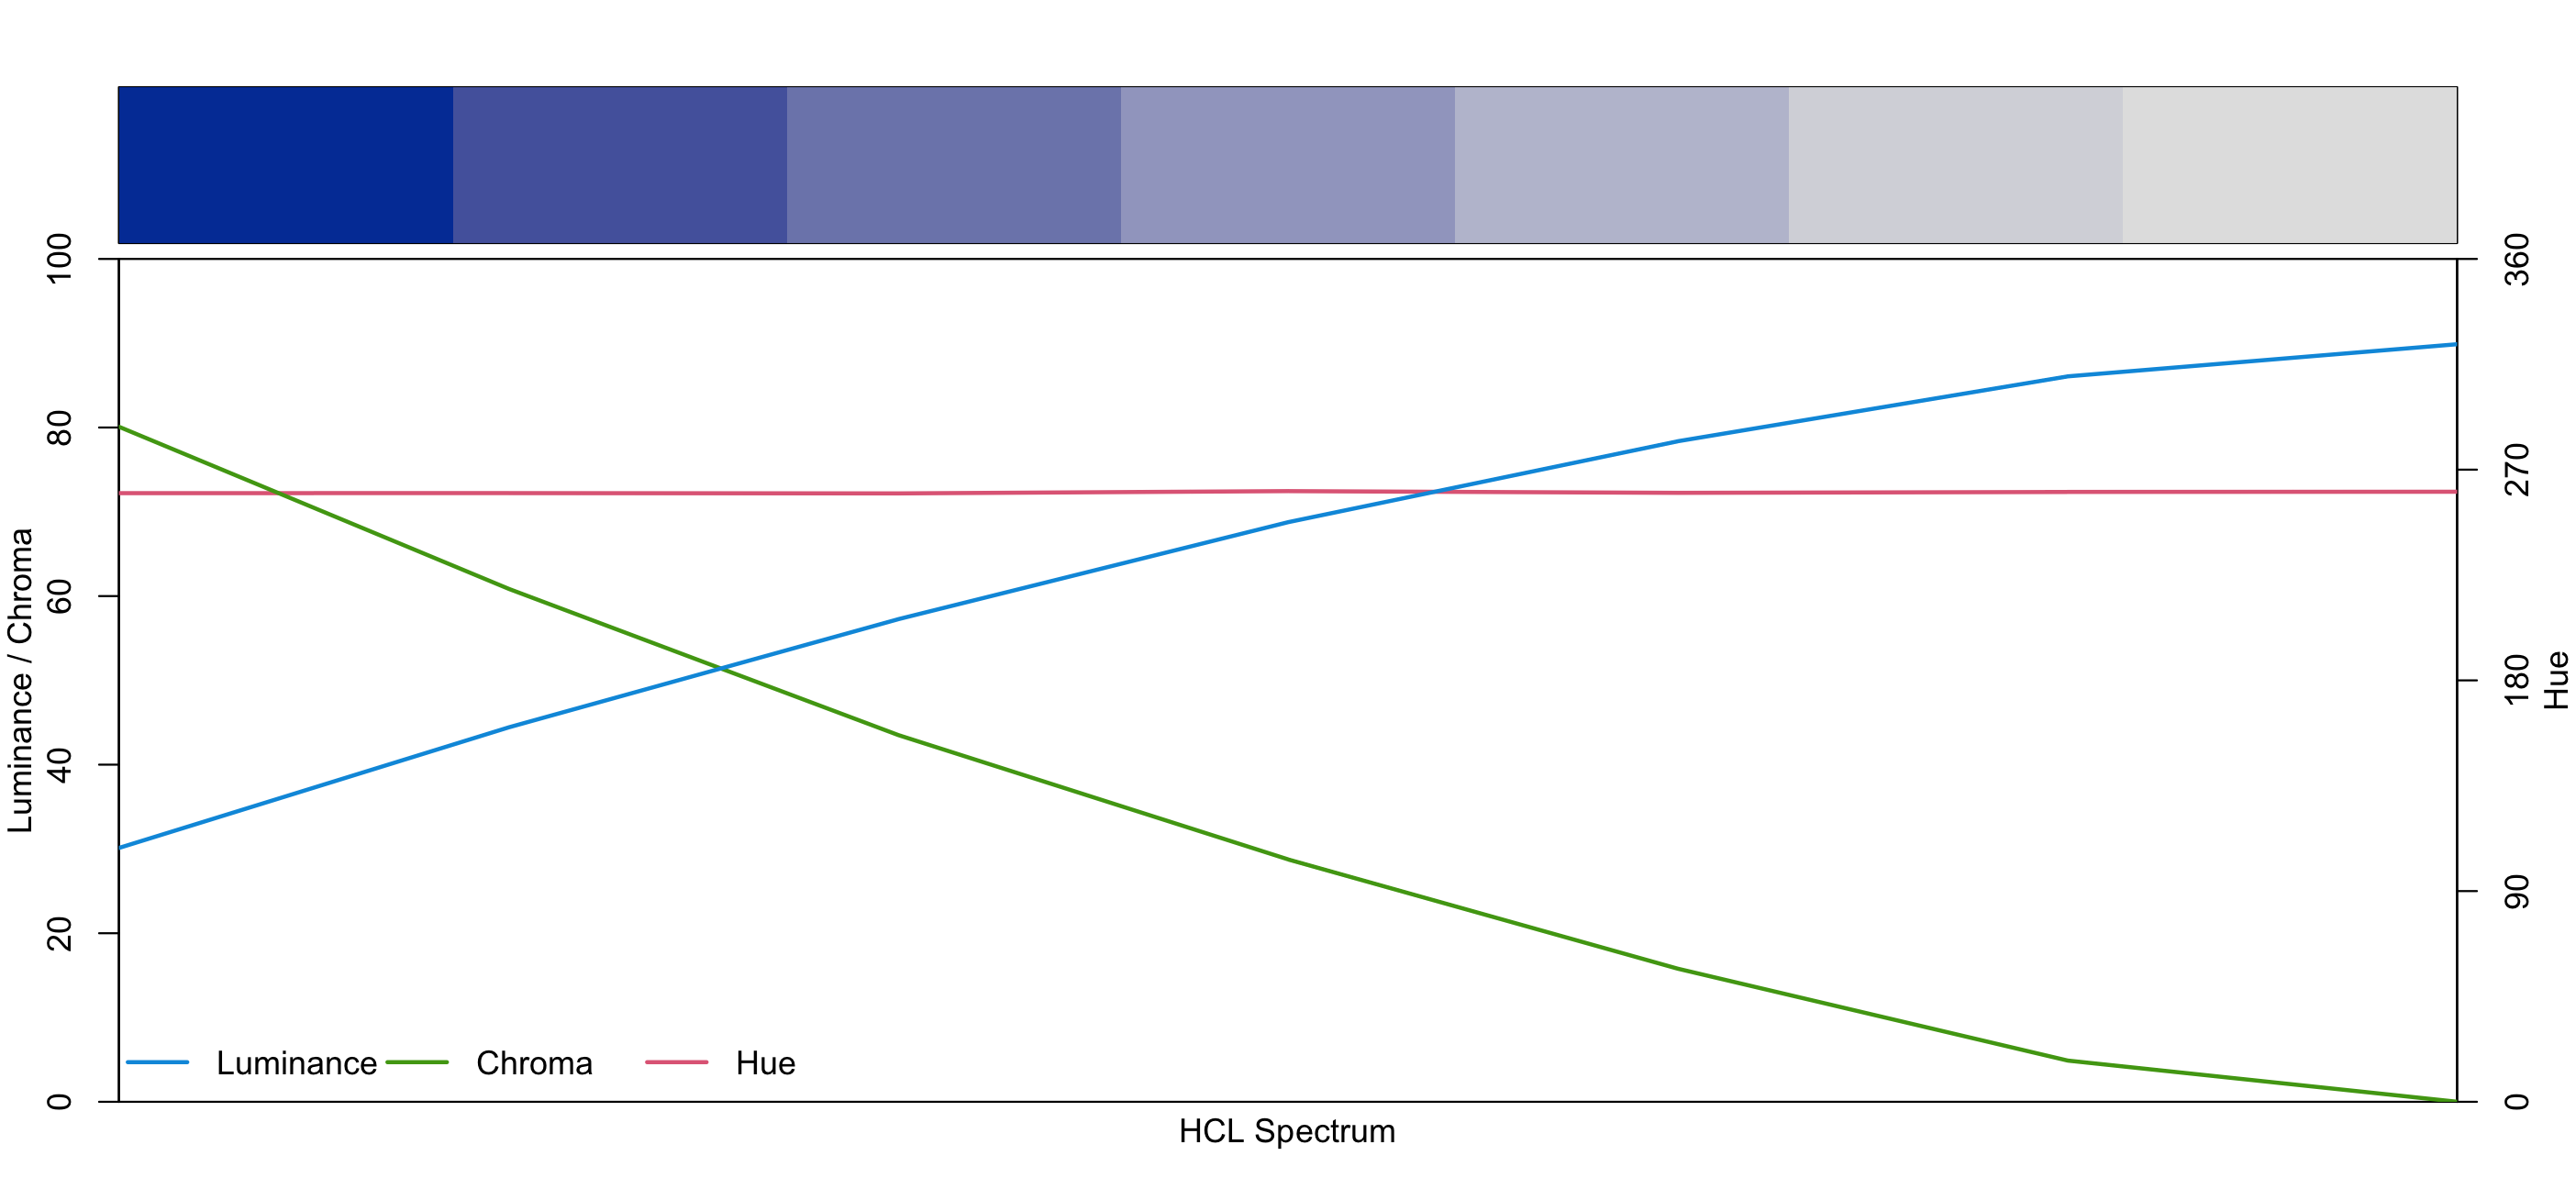
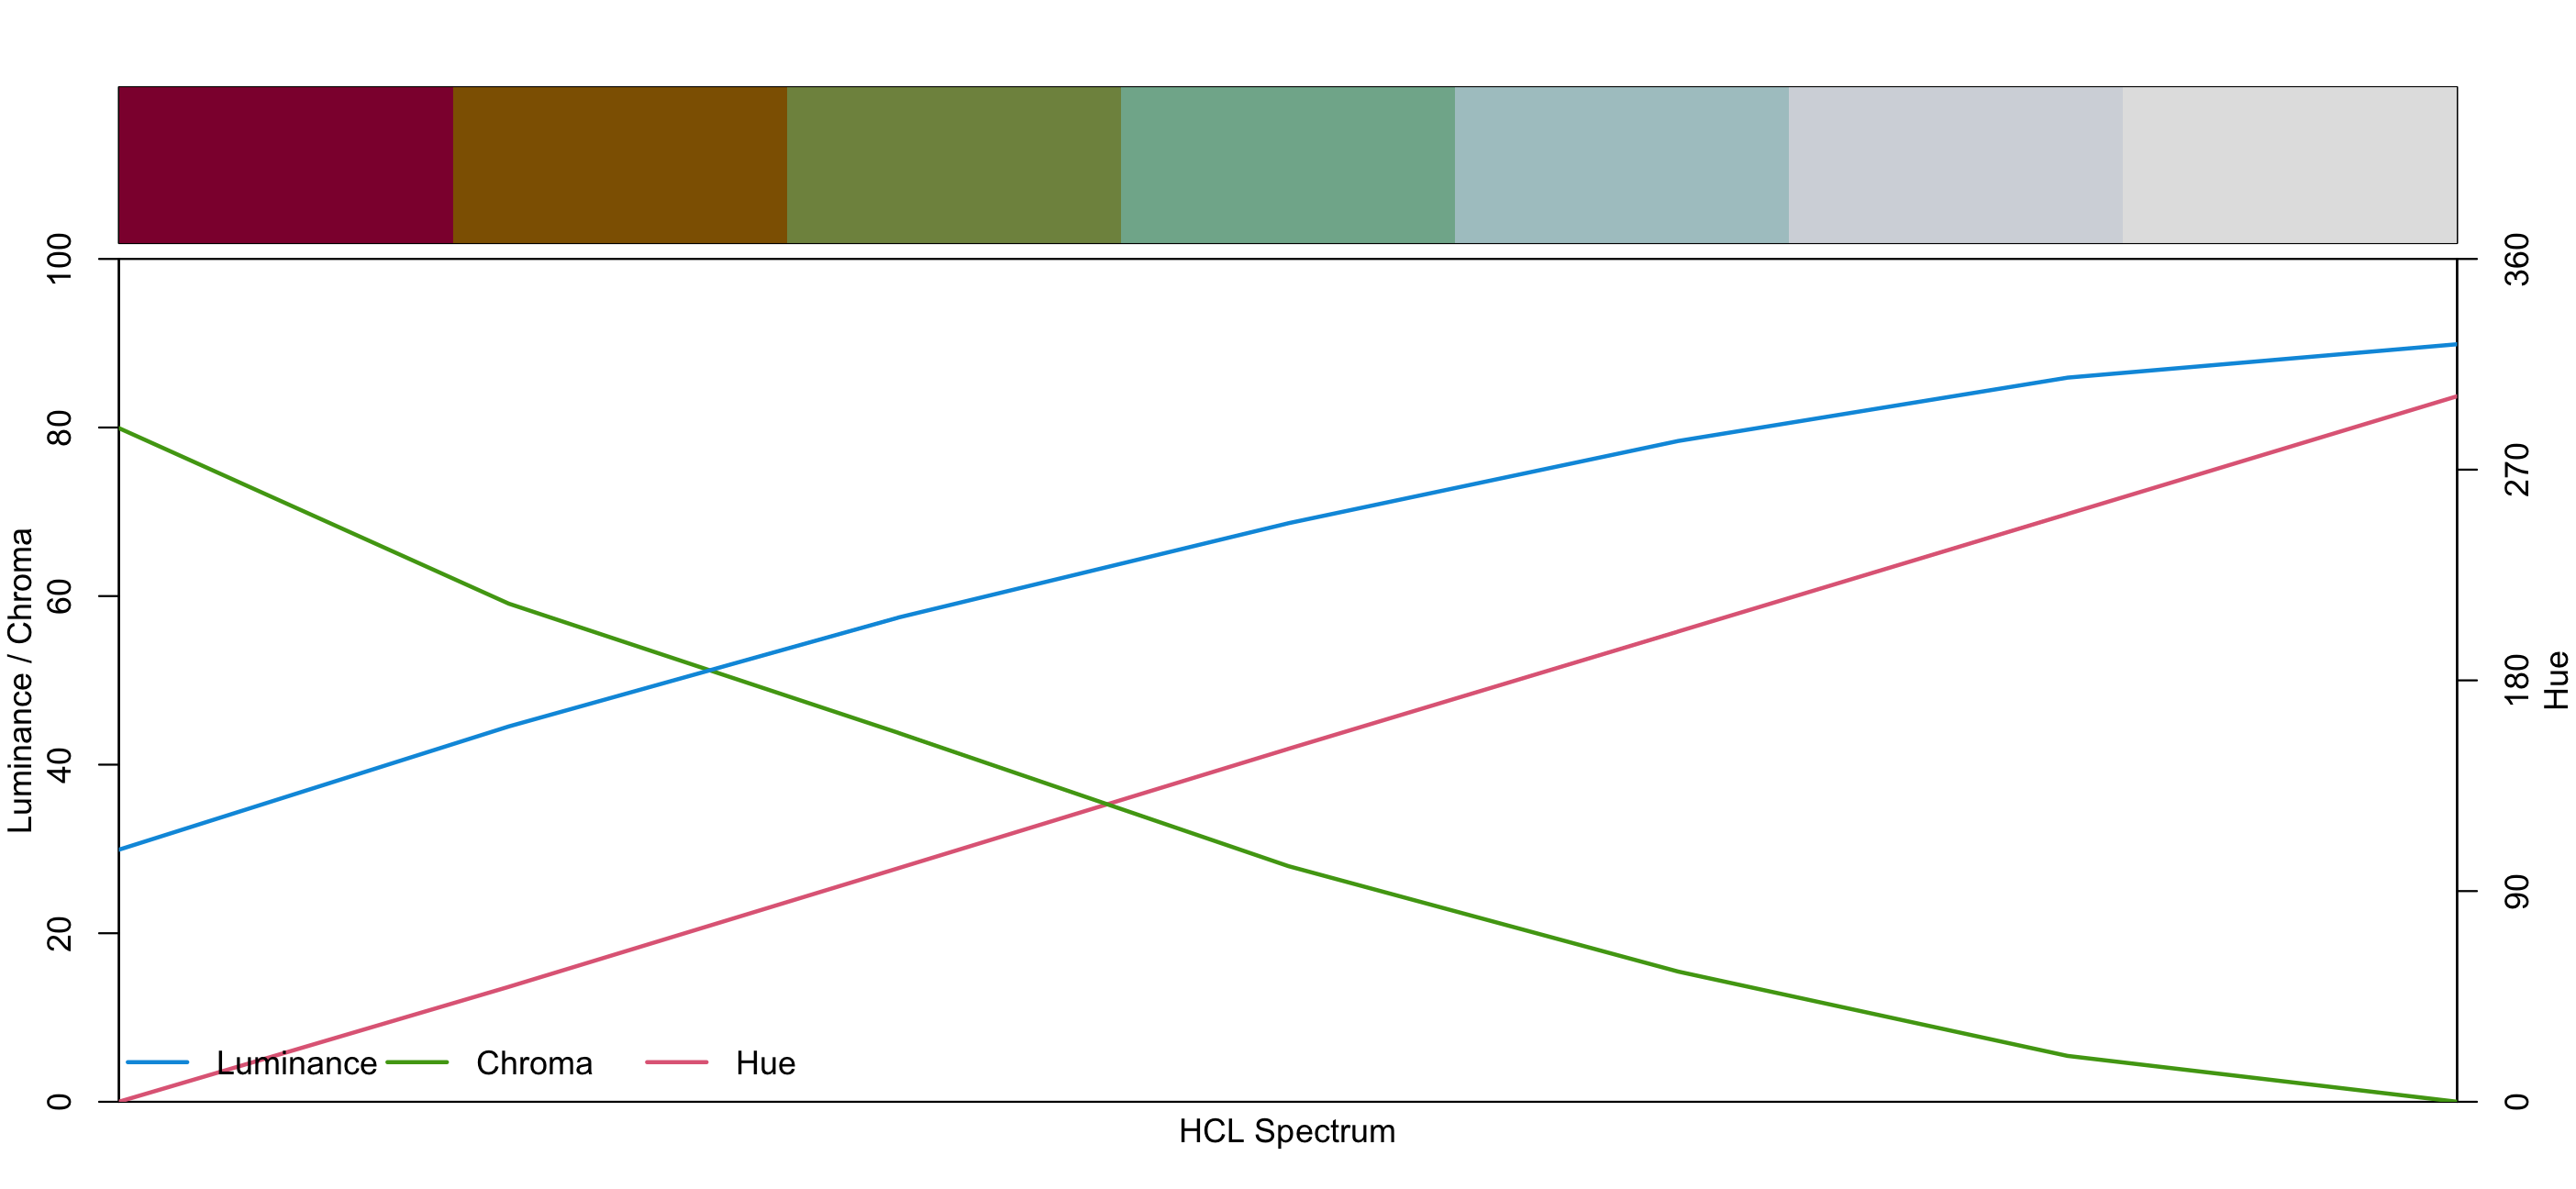
Sequential: For coding ordered/numeric information, i.e., where colors go from high to low (or vice versa).
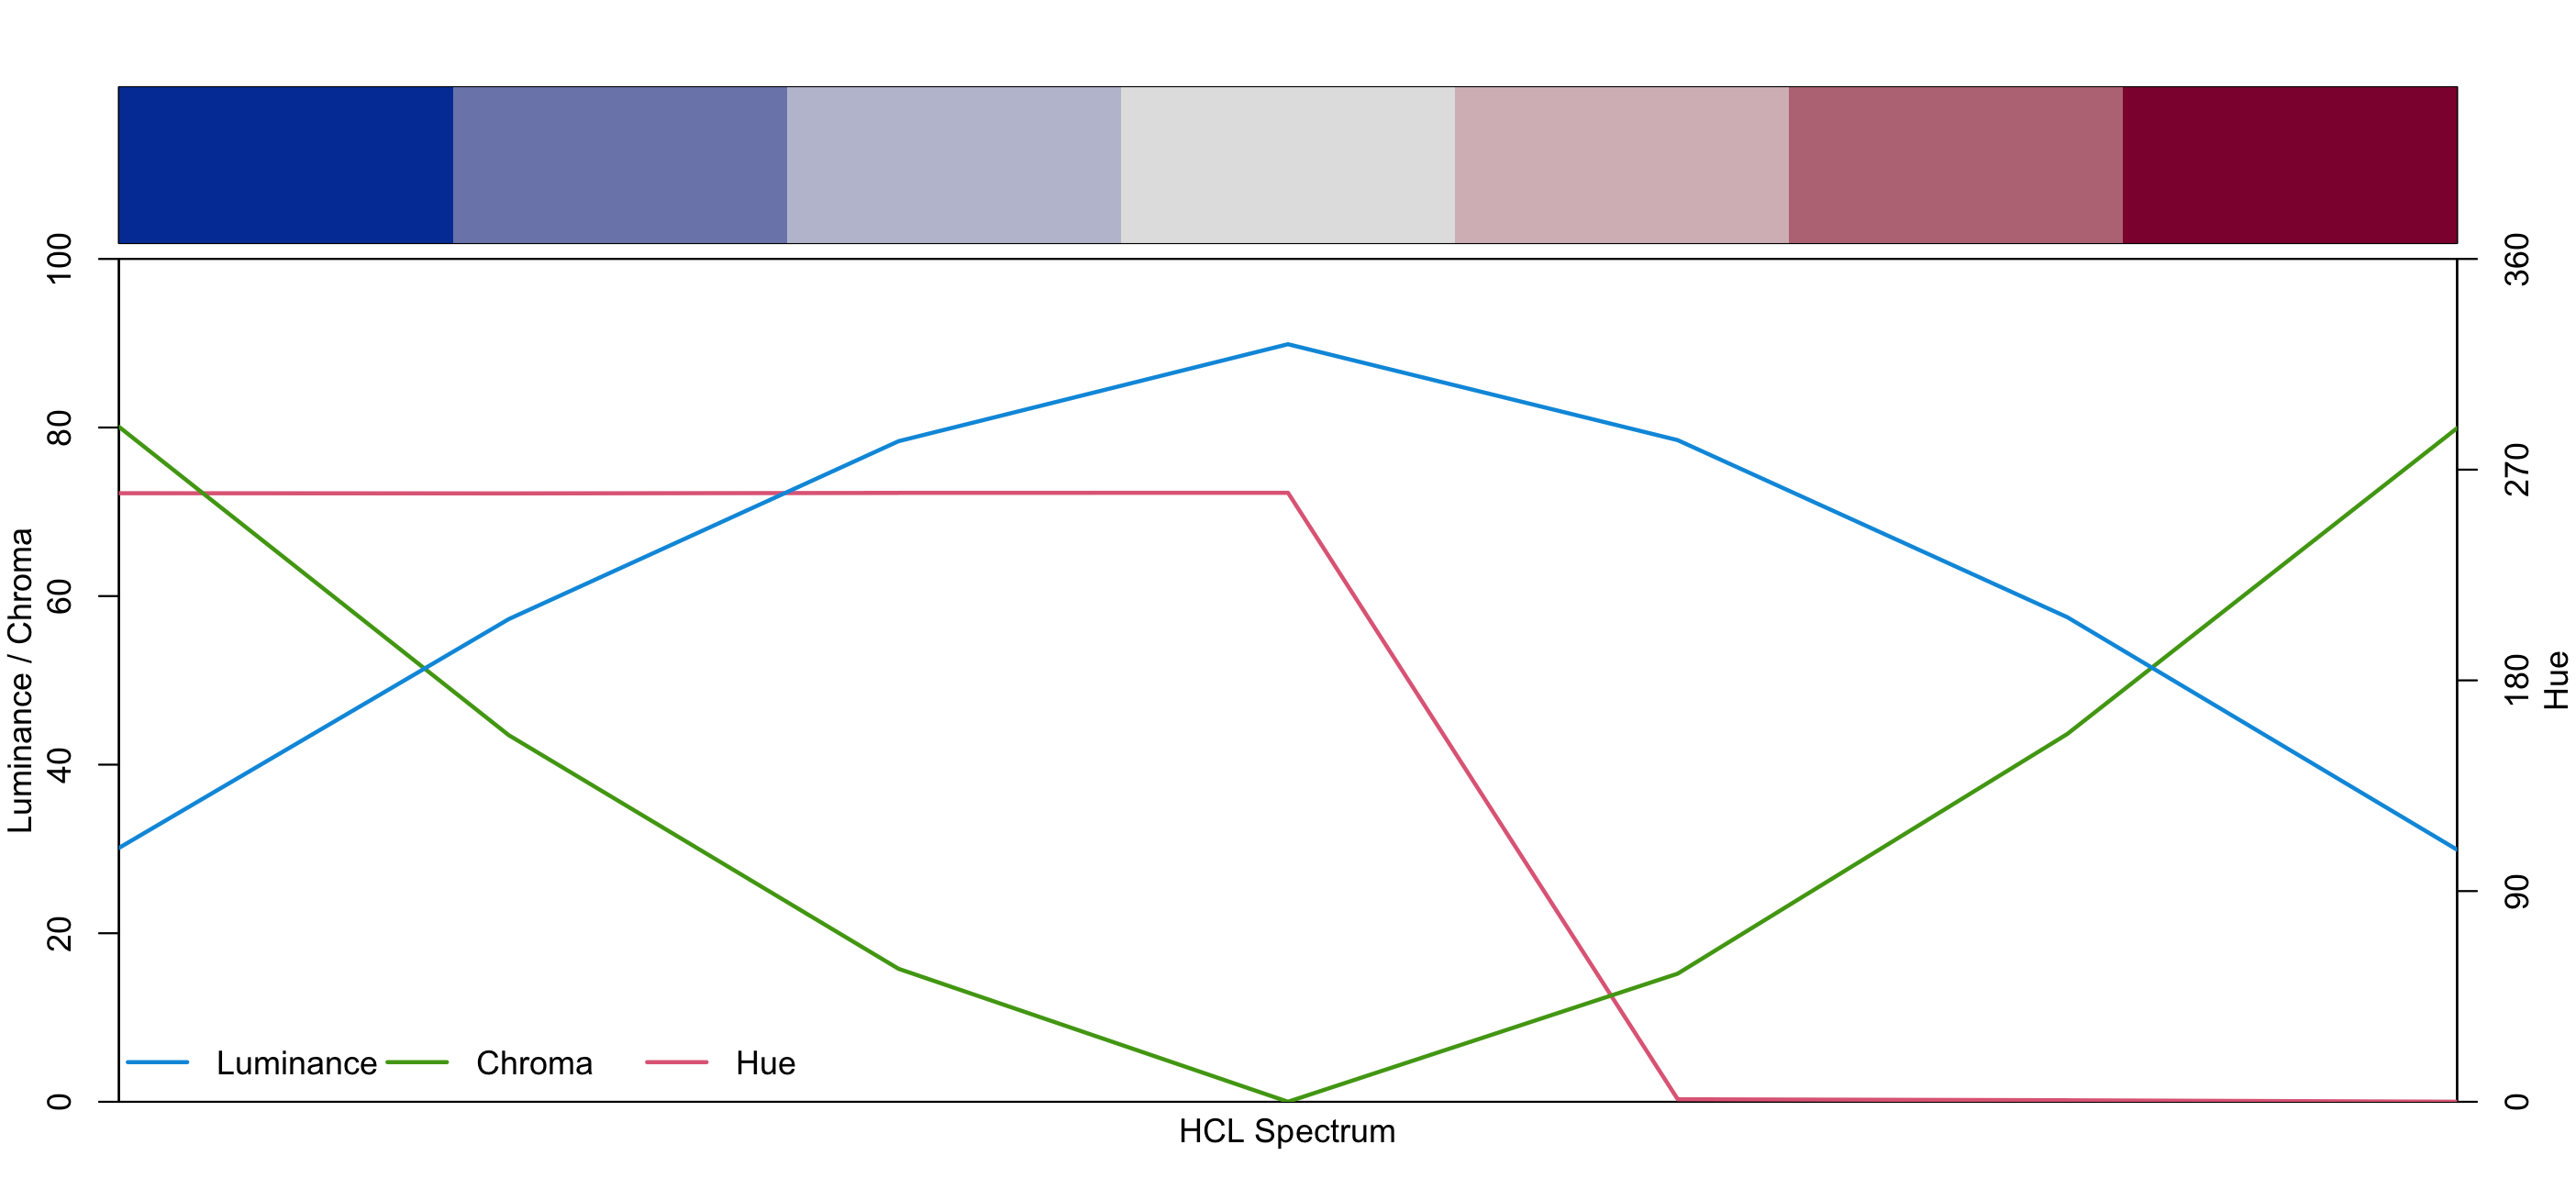
Diverging: Designed for coding numeric information around a central neutral value, i.e., where colors diverge from neutral to two extremes.
(From the R help file on colour palettes)
Qualitative: Every colour has same weight
Sequential: Colours go low - high
Sequential: Multiple hues
Diverging: Neutral value to two extremes
Improving the BoM plot
- Multi hue
- Perceptually uniform
- Colourblind safe?
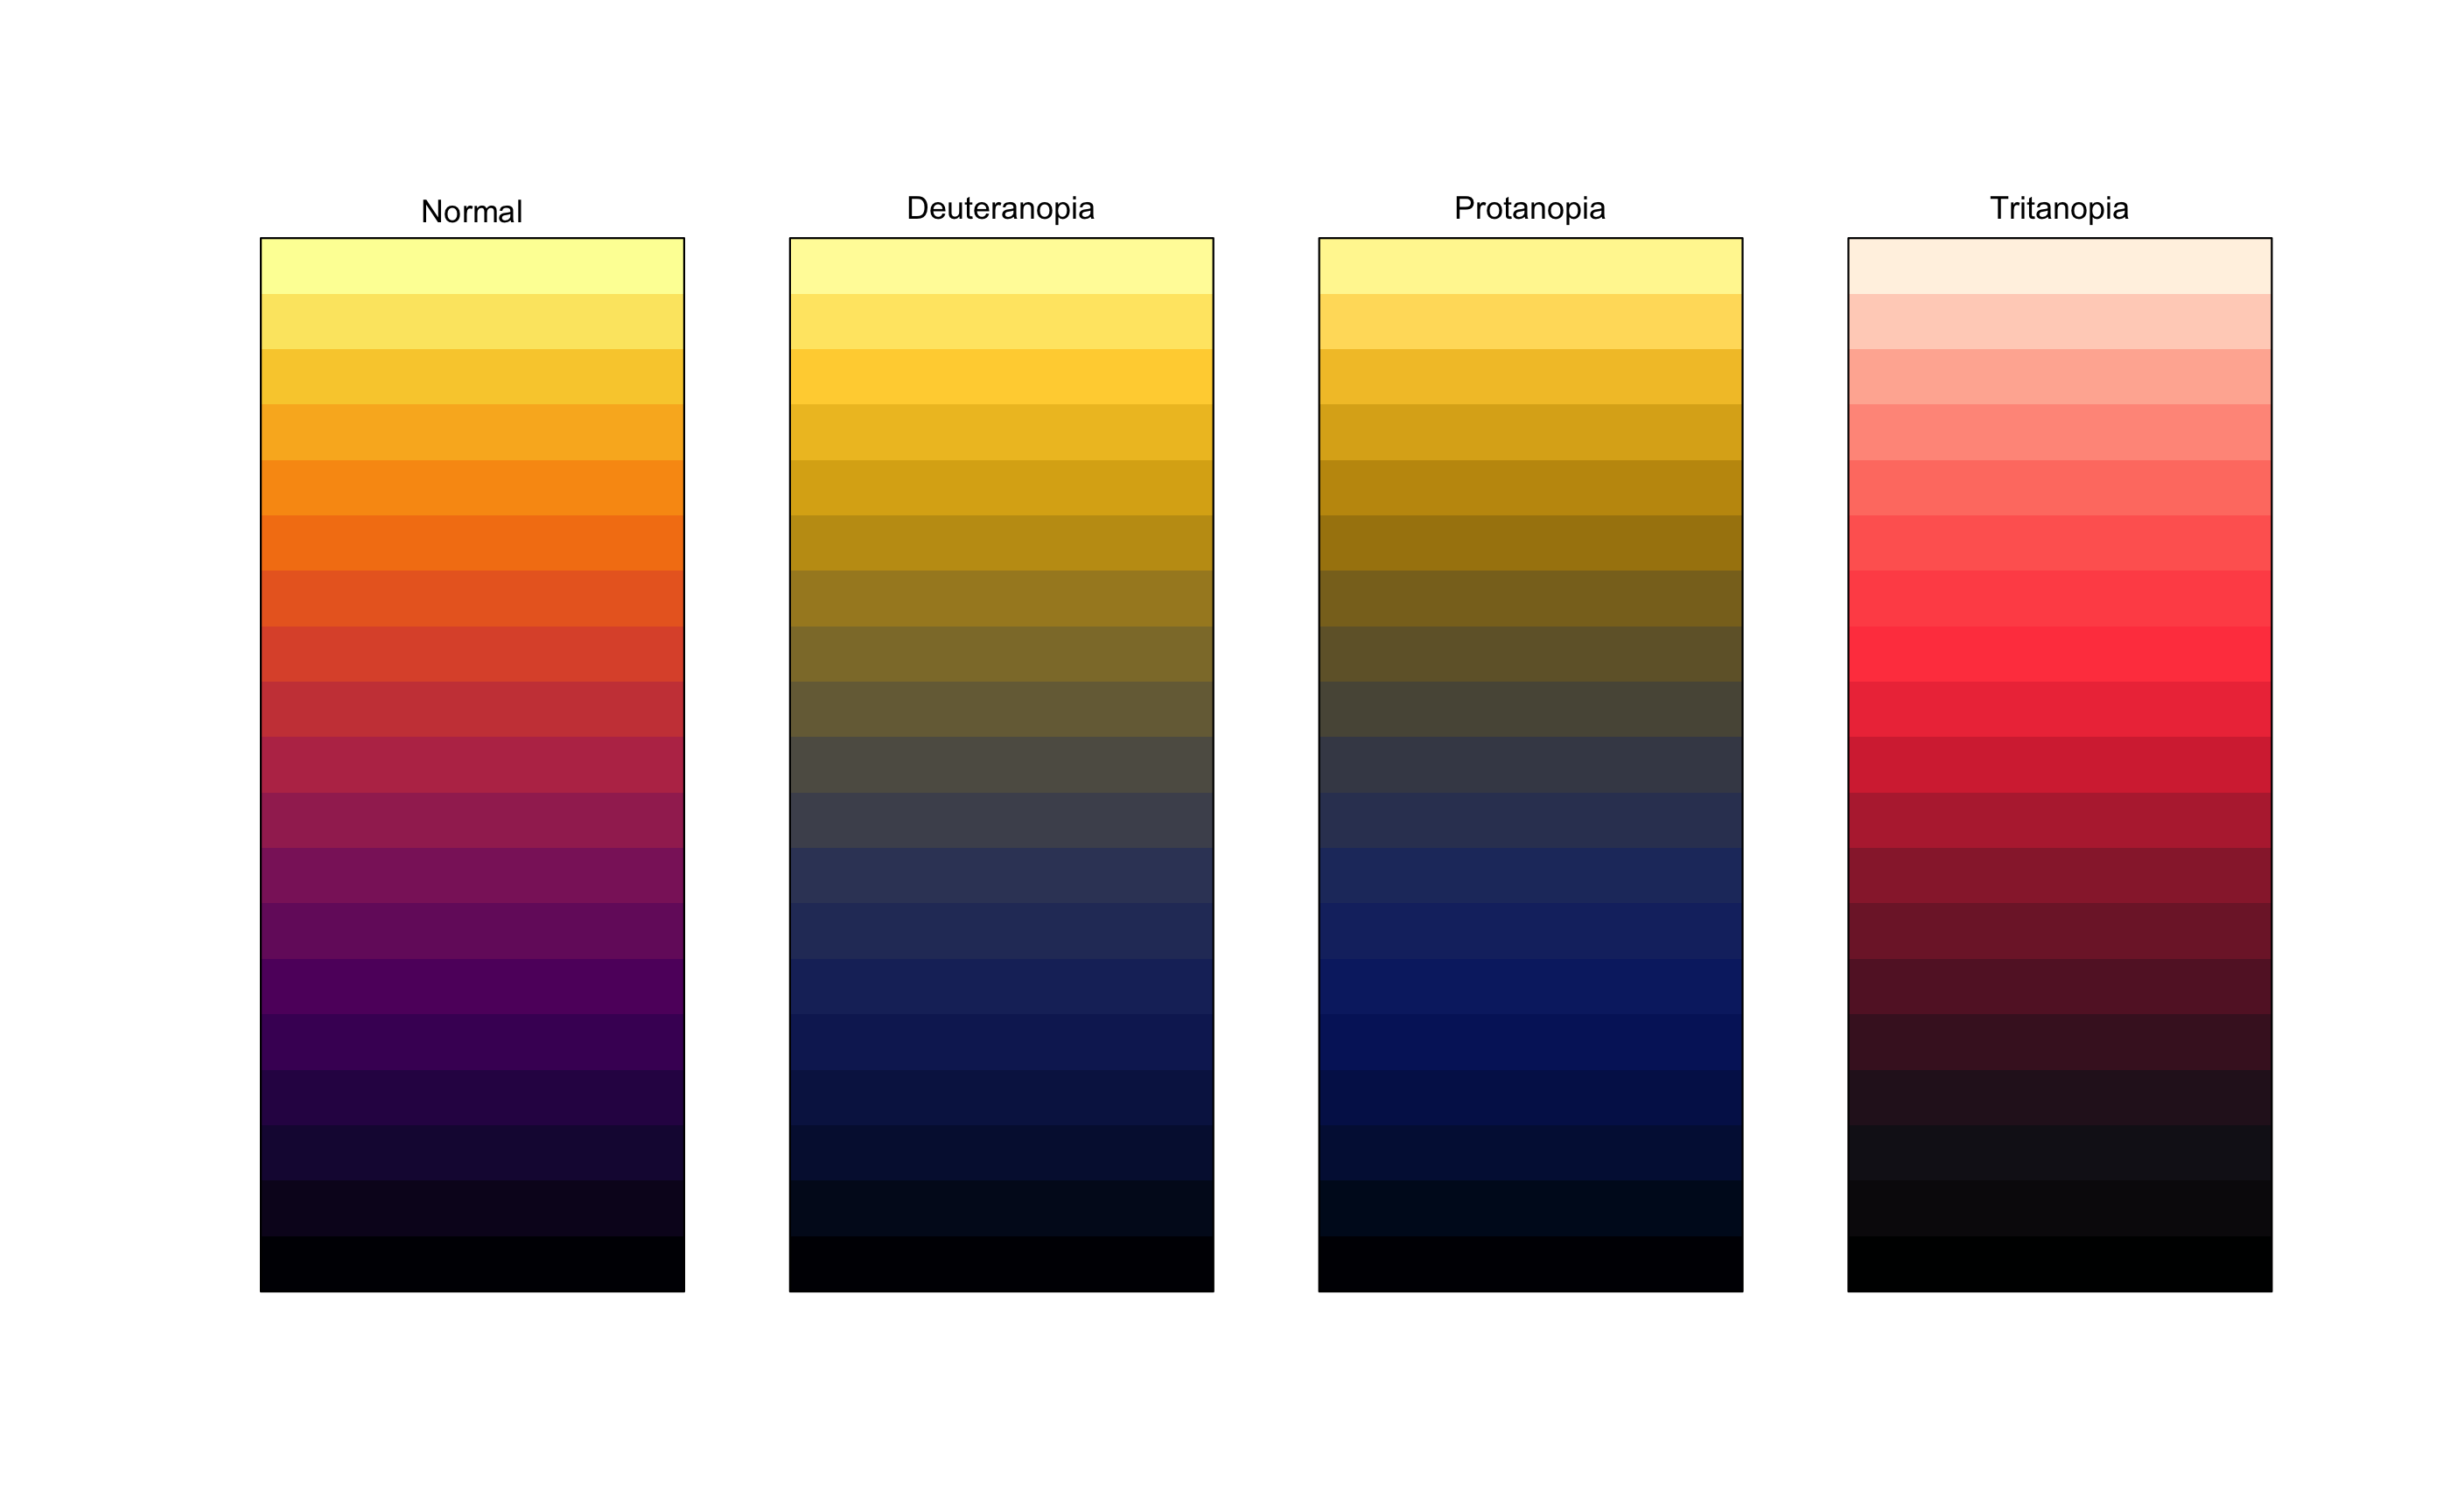
Exploring colourblindness in BoM palettes
BoM
Viridis
Improving the BoM plot
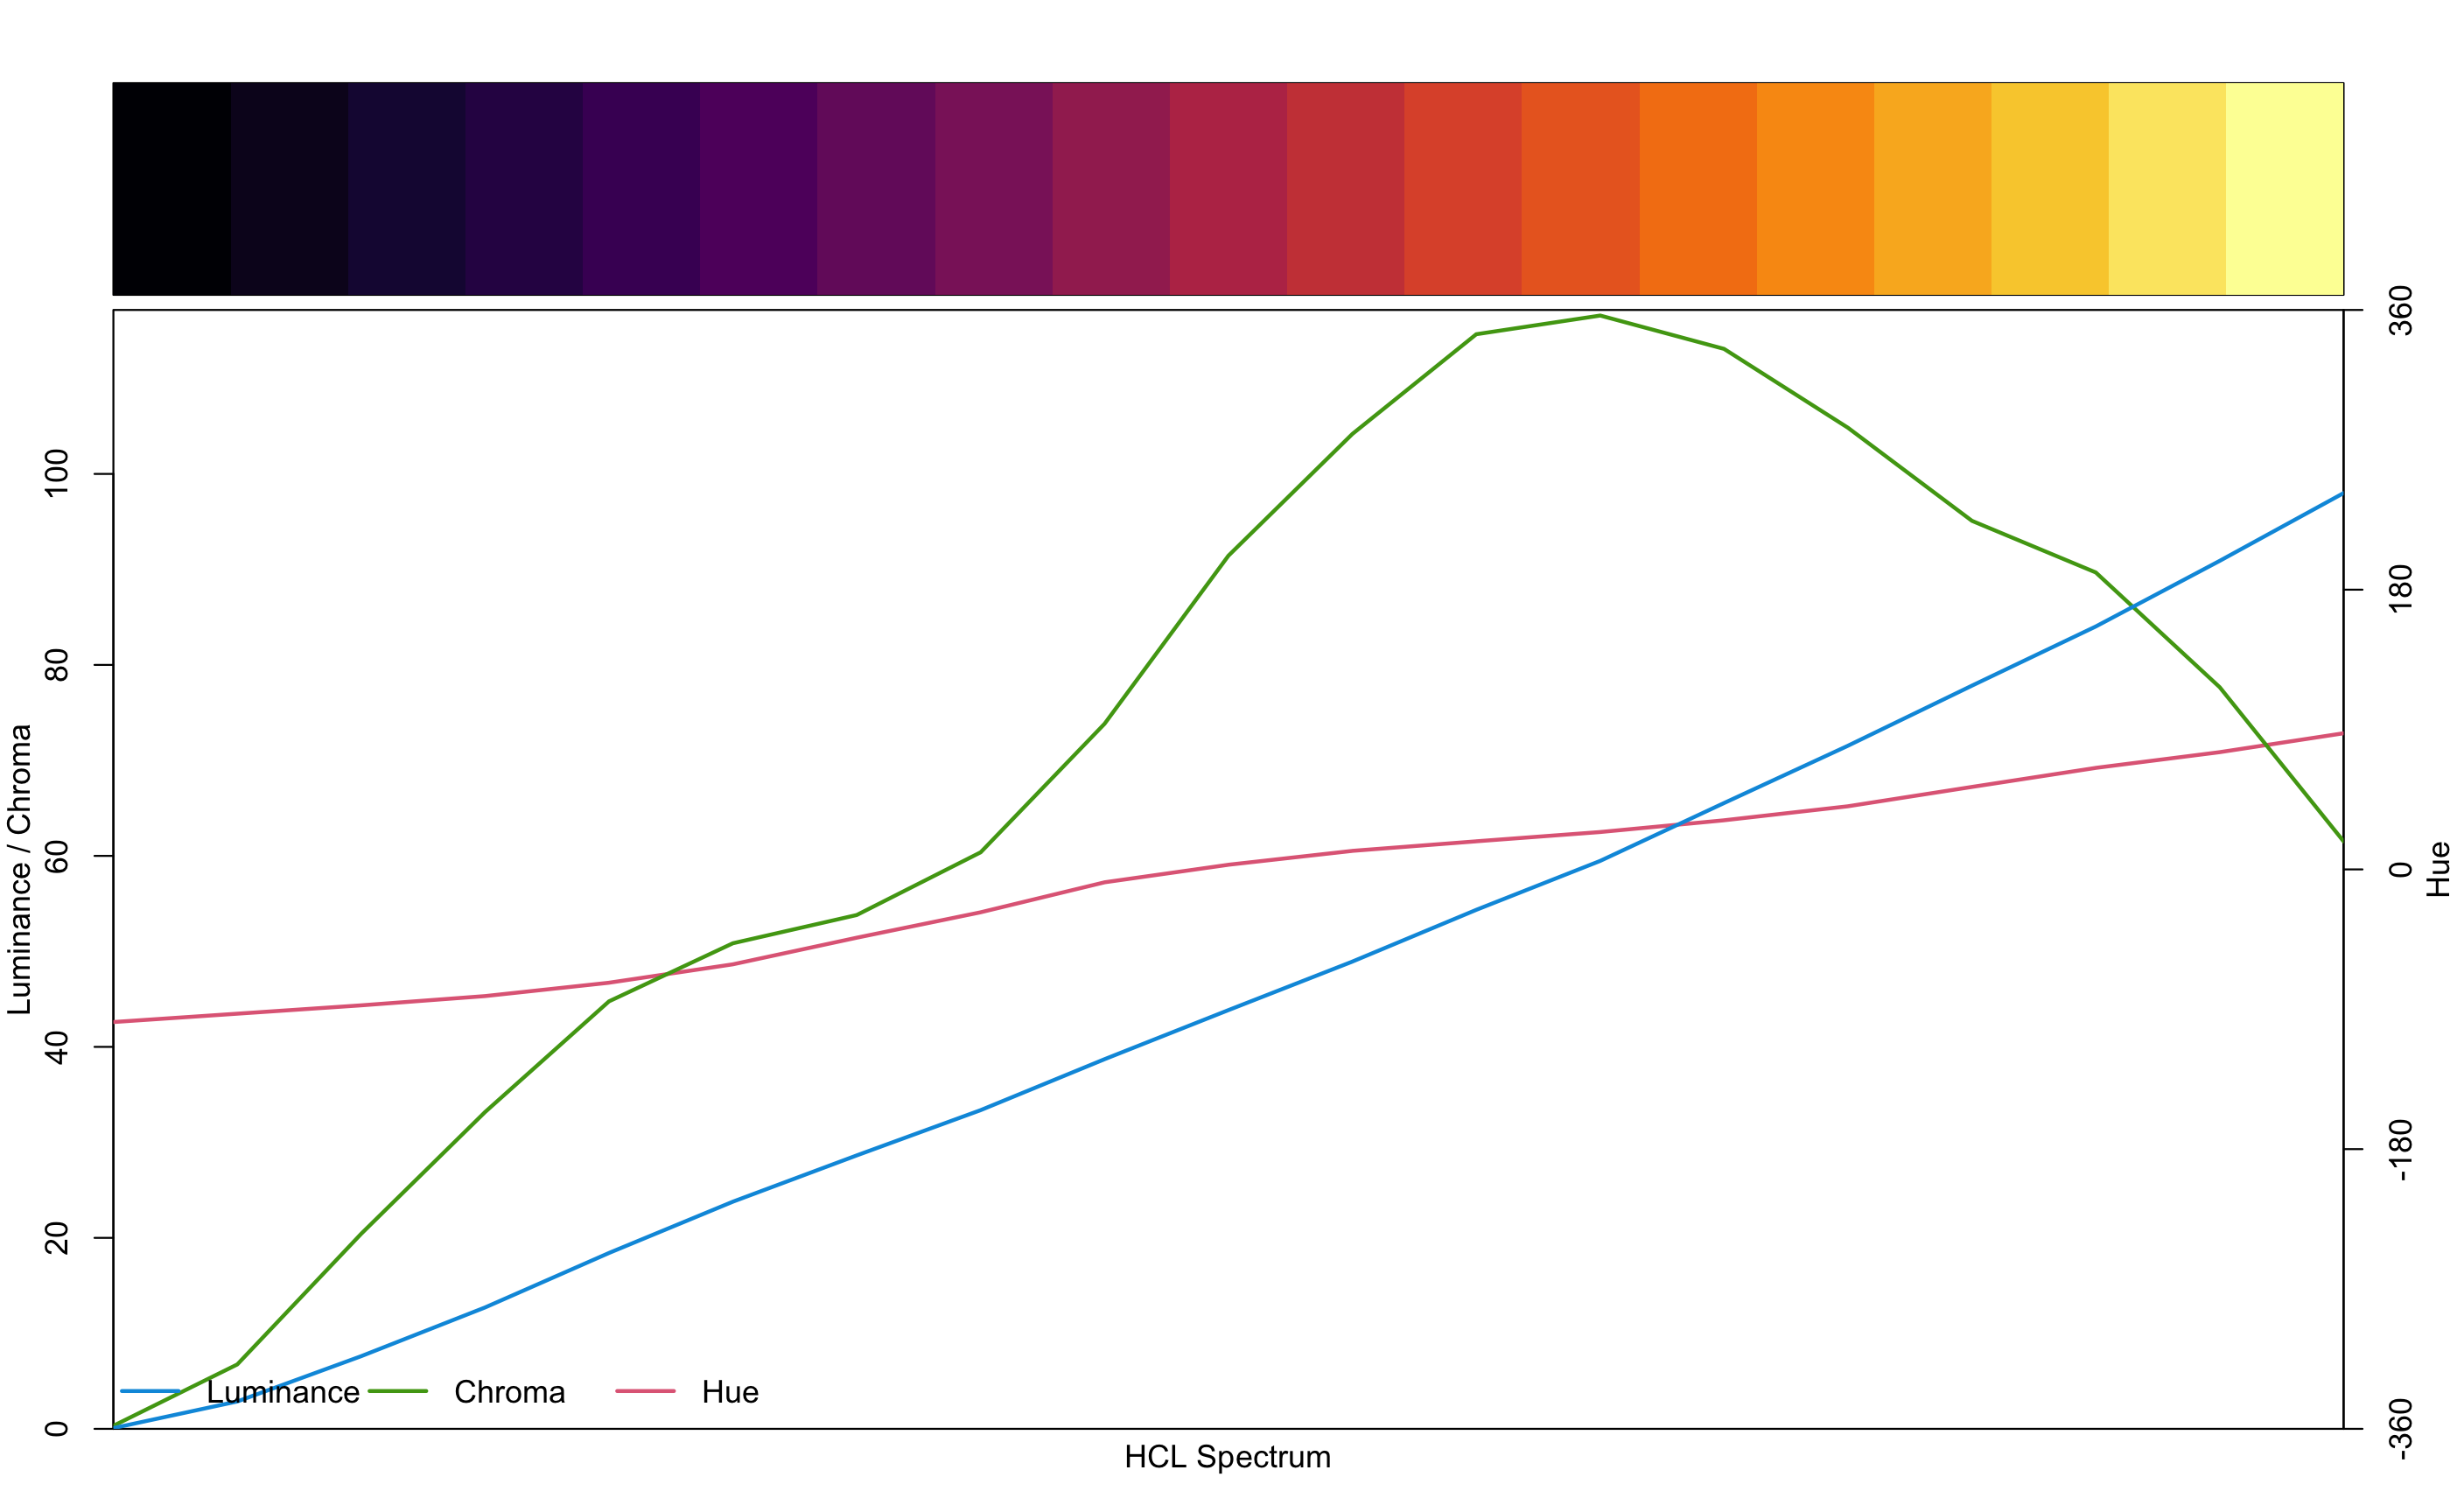
Improving the BoM plot
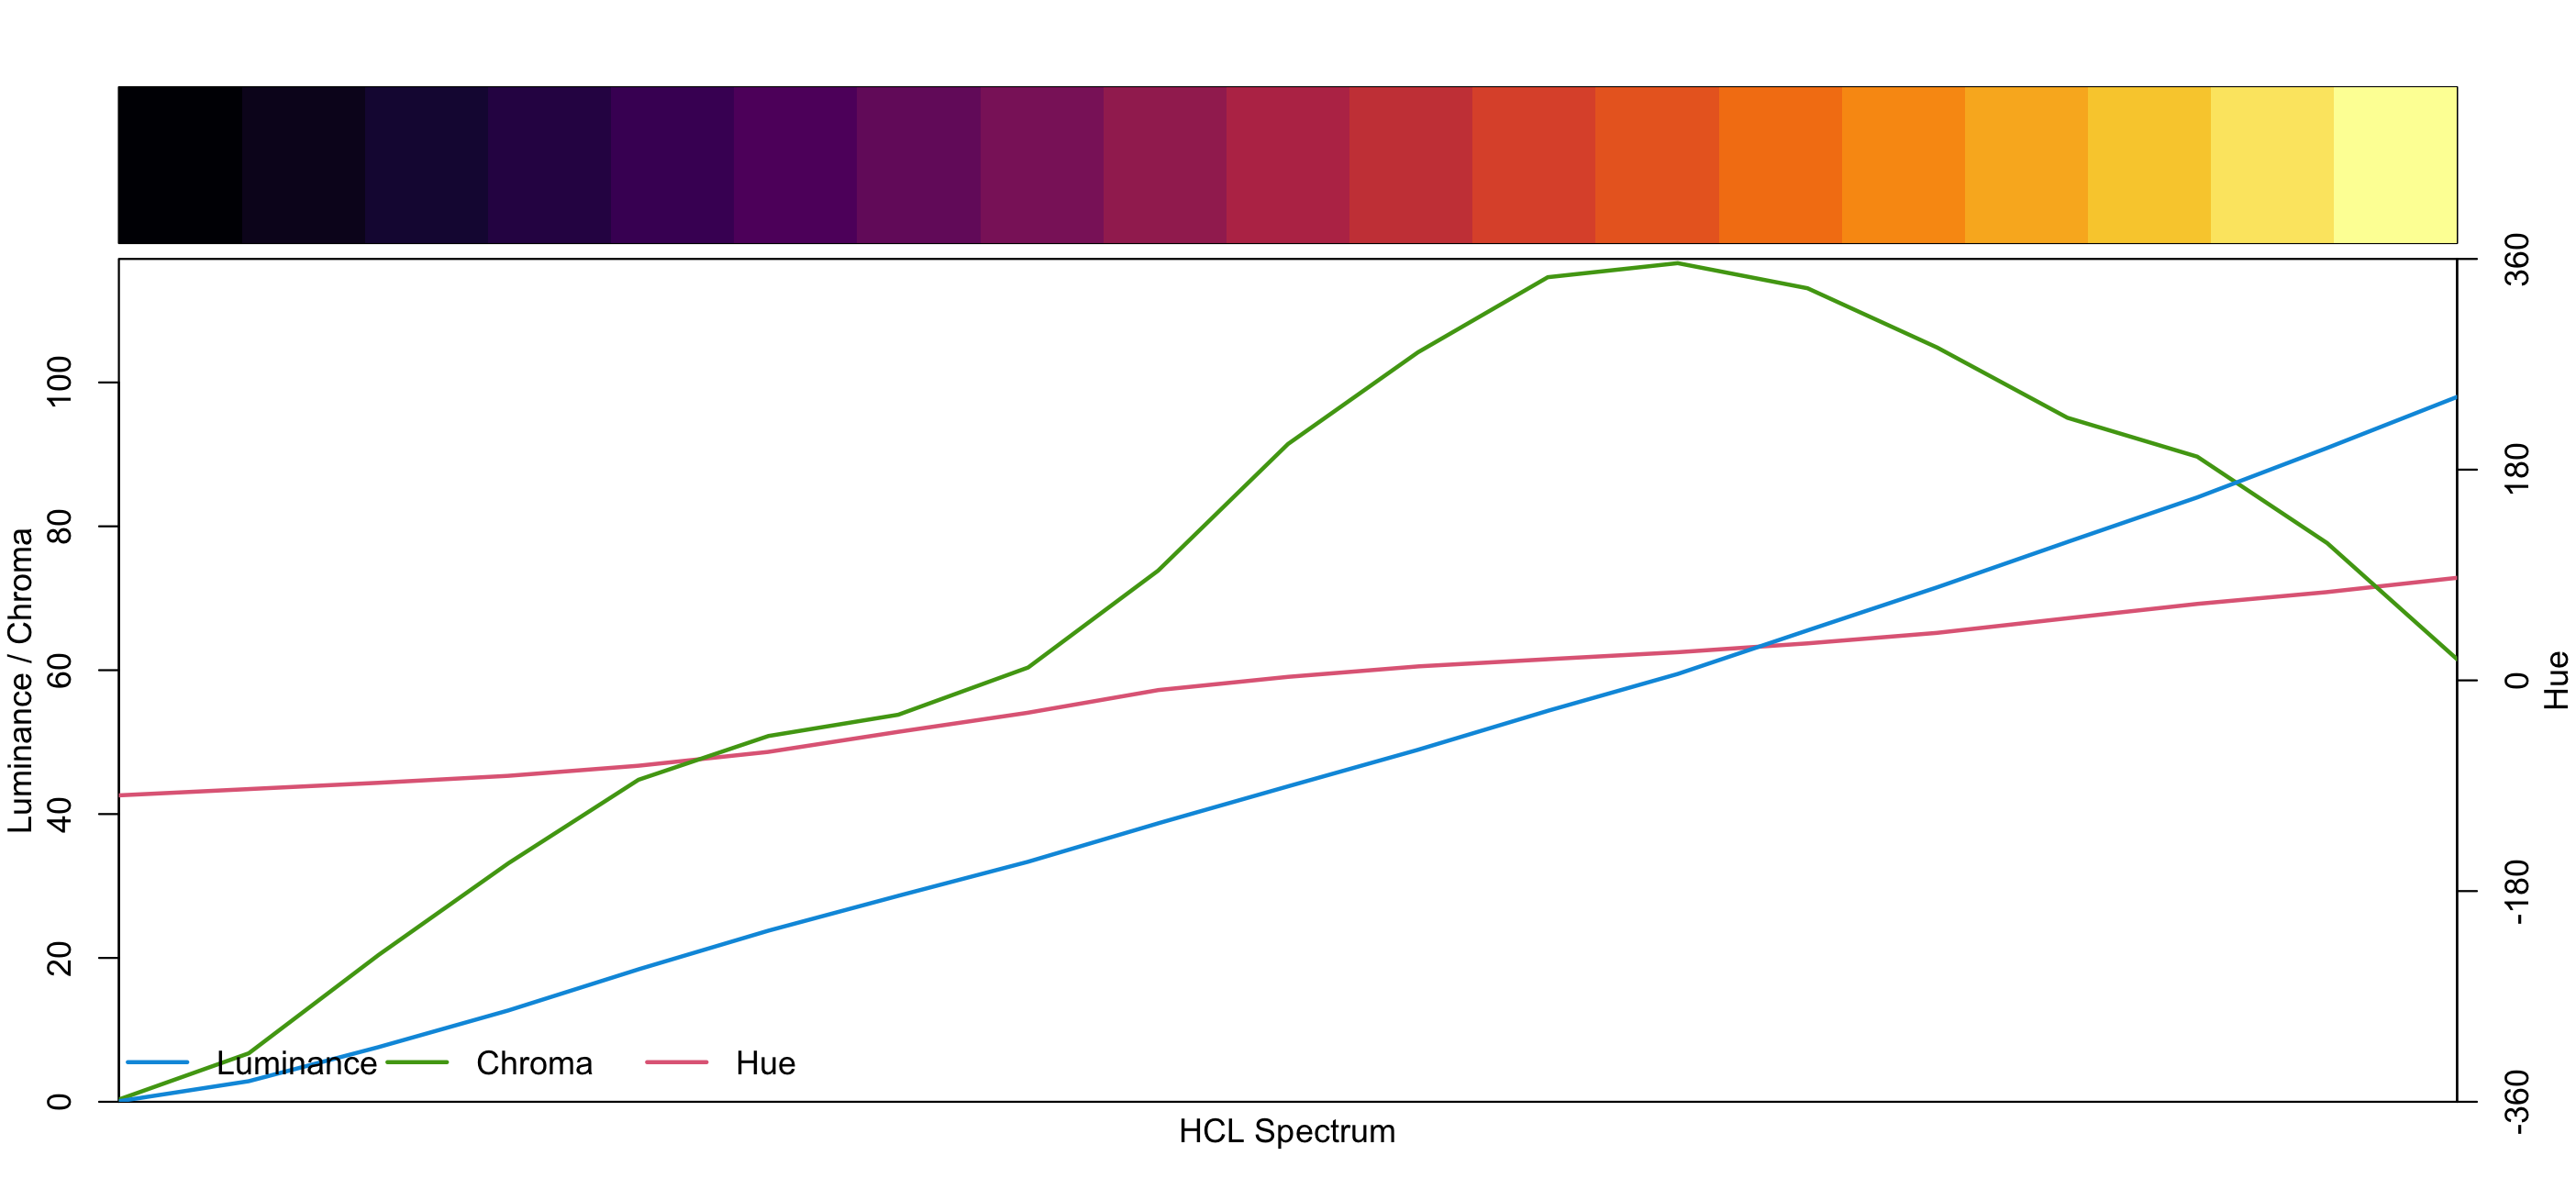
- Multiple hues
- Luminance places importance on high/low values
Creating your own colour palette with colorspace
- Decide what type of palette you want (Sequential, Diverging, etc)
- Decide what colours you want to go through
sequential_hcl(n = 20, h = 300)
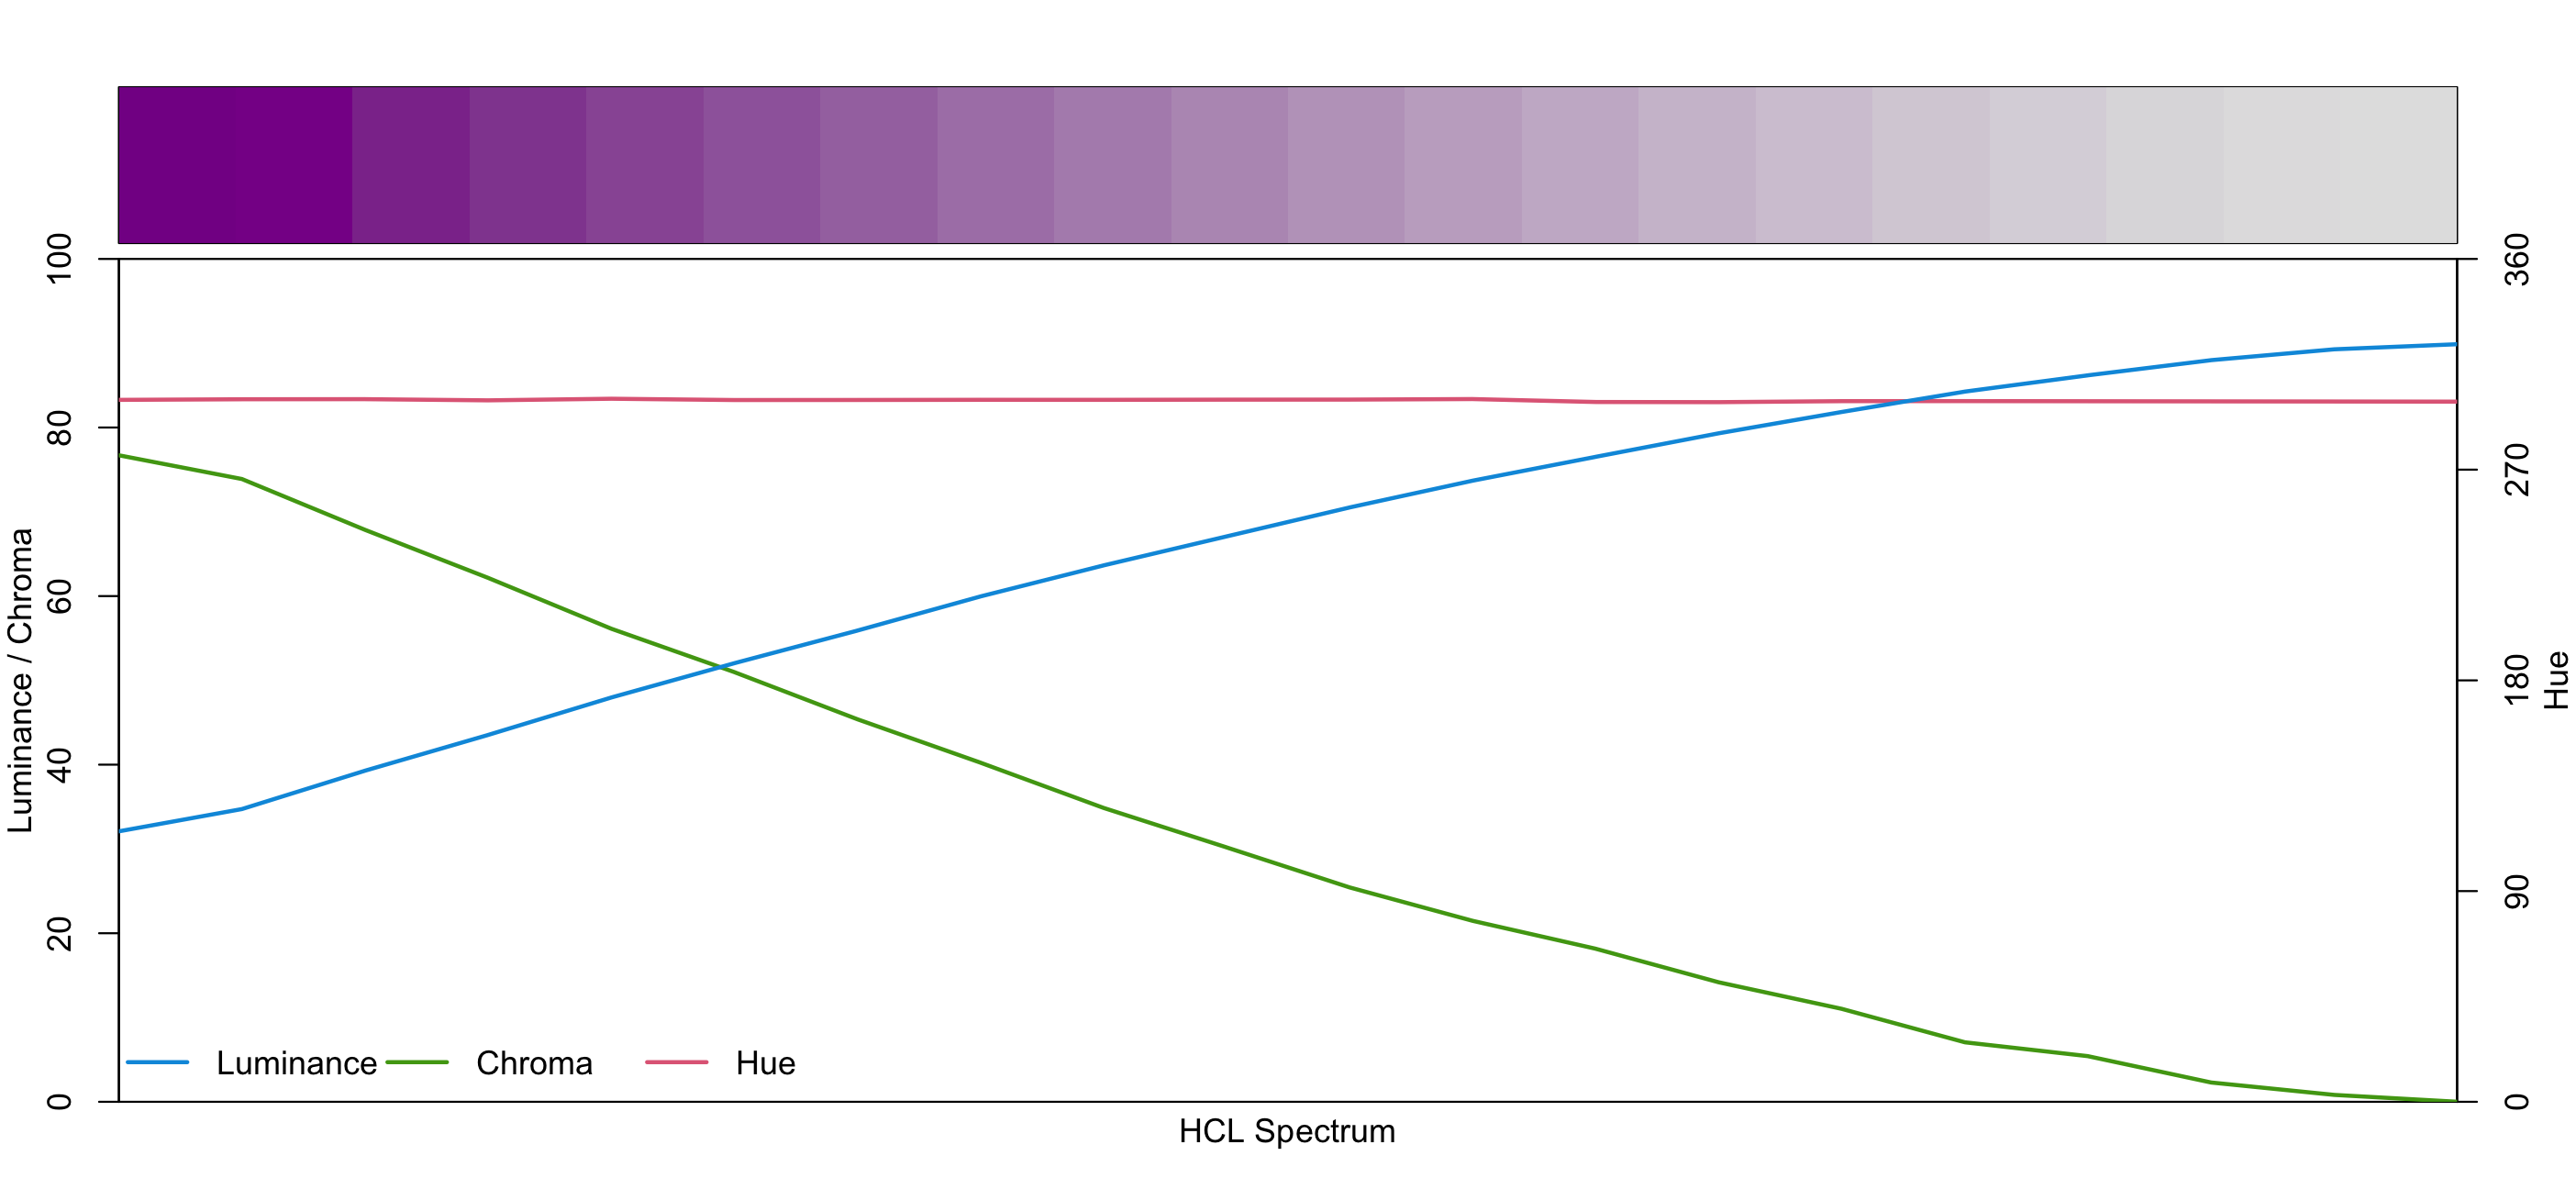
Aside: the hue is a colour wheel
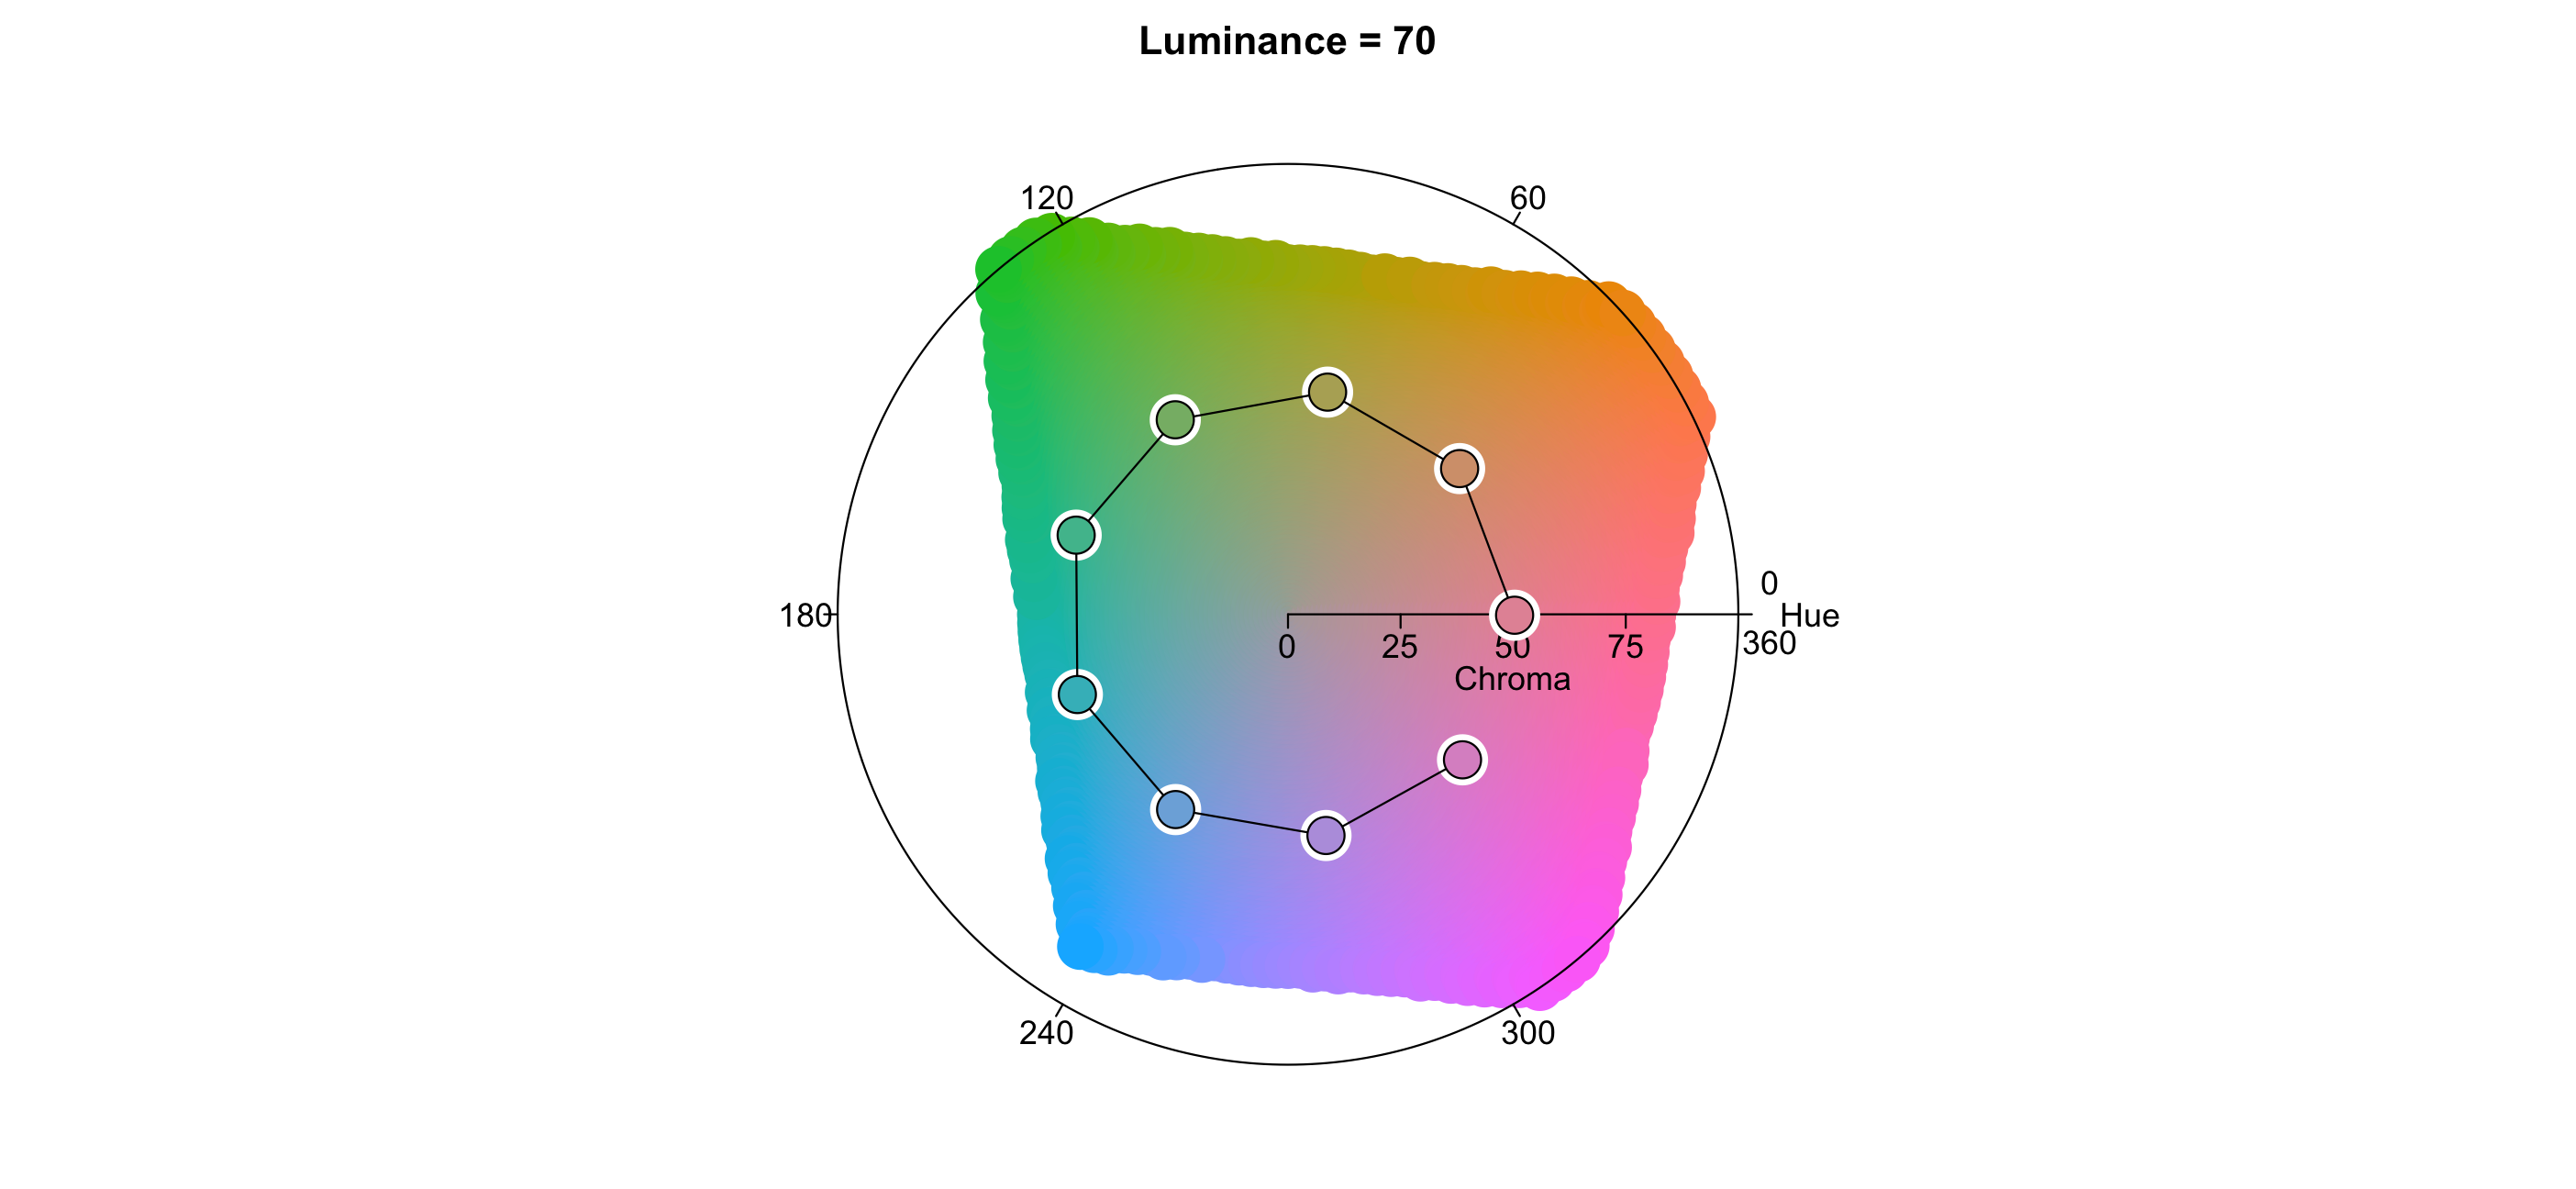
sequential_hcl(n = 20, h = c(360, 120))

Use sequential_hcl and provide two hues
Preview colours with demoplot(type = "map")

Preview colours with demoplot(type = "heatmap")

Check colourblindness protan and use demoplot

Check colourblindness protan and use demoplot (compare to rainbow)

Exploring palettes: demo
hcl_palettes("qualitative", plot = TRUE)hcl_palettes("sequential", plot = TRUE)hcl_palettes("diverging", plot = TRUE)Tools for exploring colourblindness:
- Using the hex/colour codes
- Colorspace:
protan/deutan/tritan - prismatic:
check_color_blindness
- Colorspace:
- For a ggplot object
- colorblindr:
cvd_grid
- colorblindr:
- For an image
- colorspace:
cvd_emulator
- colorspace:
Tools for creating good colours
- Colorspace:
qualitative_hclsequential_hcldiverging_hcl
- Pick the hue/chroma/luminance you want to travel through
A workflow for choosing a colour palette
- What type of data is it?
- Decide the colour palette type:
- Qualitative: Are the categories equal?
- Sequential: Does the value go from low to high?
- Diverging: Does it have a natural balance/zero point?
- Check colourblindness:
check_color_blindness - Explore colour with
specplot(combine withprotanand friends) - Explore how it looks with
demoplot(combine withprotanand friends)
Take homes
- Colour choice matters
- Choosing colours is hard
- We can use Hue / Chroma / Luminance to describe colour
- See established palettes: colorspace / viridis / scico
- Assess colours with
colorspace::specplot() - Assess colourblindness with
colorspace::cvd_emulator() - Evaluate your own colour palettes at
hclwizard.com - Choose colour palettes with
colorspace::choose_palette()colorspace::choose_color()colorspace::hcl_color_picker()colorspace::hcl_wizard()
Thanks
Resources
- Colorspace Package by Zeileis et al
- Colorspace Paper by Zeileis et al
- Colorspace talk by Achim Zeileis
- http://hclwizard.org/ website for assessing colour
Resources
Colophon
- Slides made using xaringan
- Extended with xaringanthemer
- Colours taken + modified from lorikeet theme from ochRe
- Header font is Josefin Sans
- Body text font is Montserrat
- Code font is Fira Mono
- template available: njtierney/njt-talks
Learning more
nj_tierney
njtierney
nicholas.tierney@gmail.com
End.
Workflows
Explore rainbow palette with specplot: Rainbow + specplot
rainbow(n = 20) %>% specplot()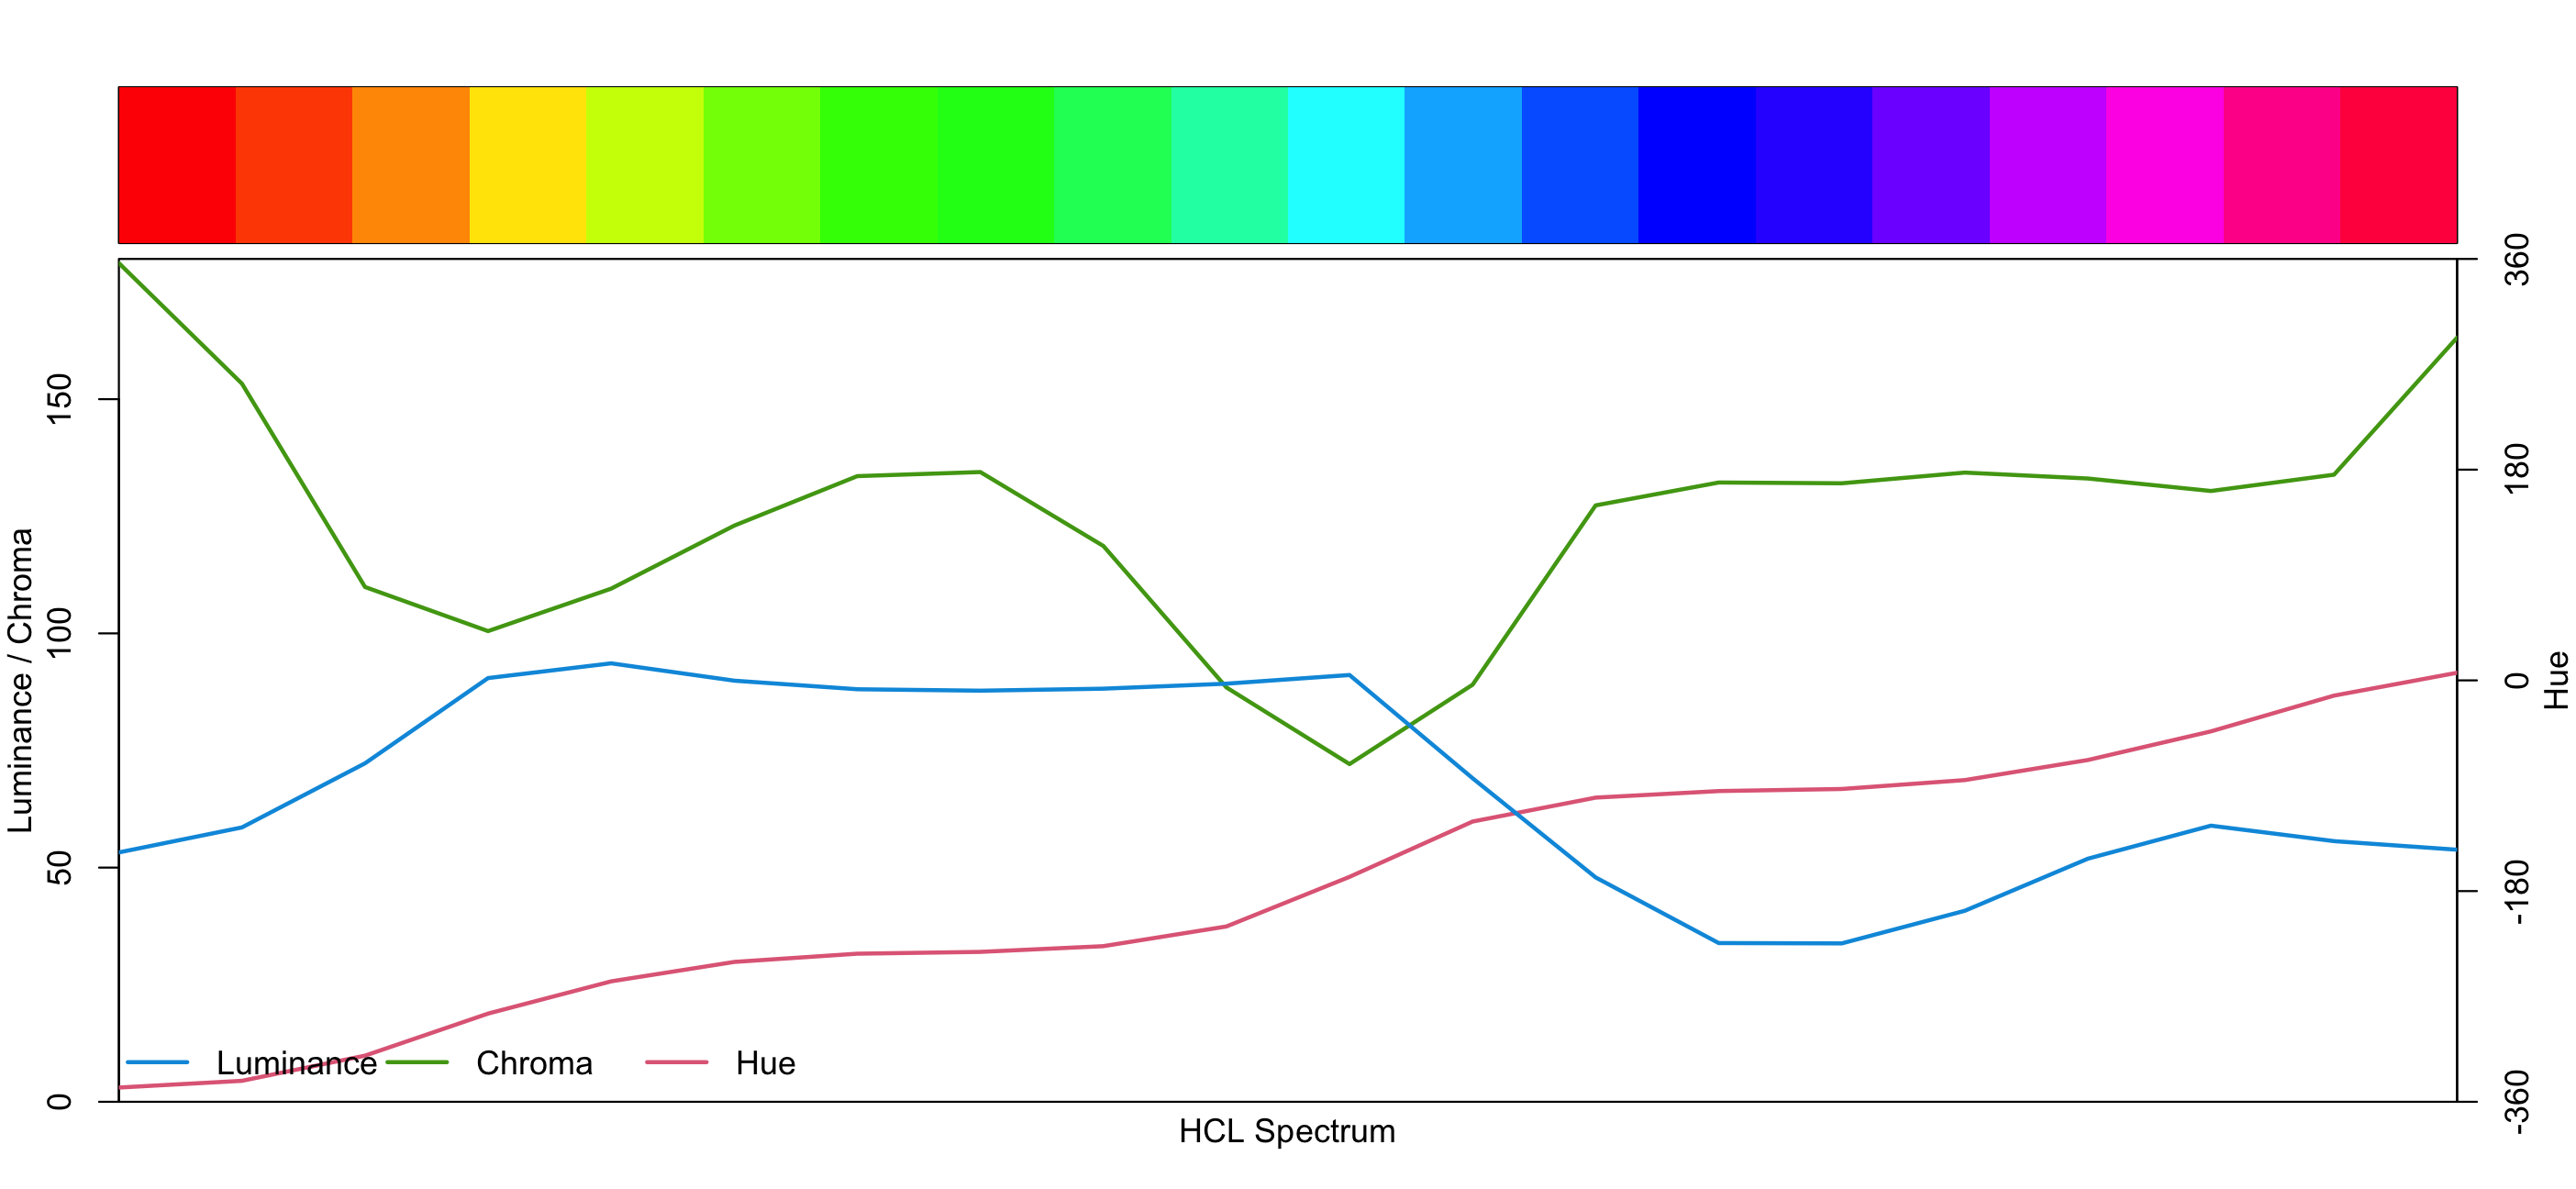
Explore rainbow palette with colorblindness specplot: Rainbow + hclplot
rainbow(n = 20) %>% hclplot()
Explore rainbow palette with colorblindness specplot: Rainbow + protan + specplot
rainbow(n = 20) %>% protan() %>% specplot()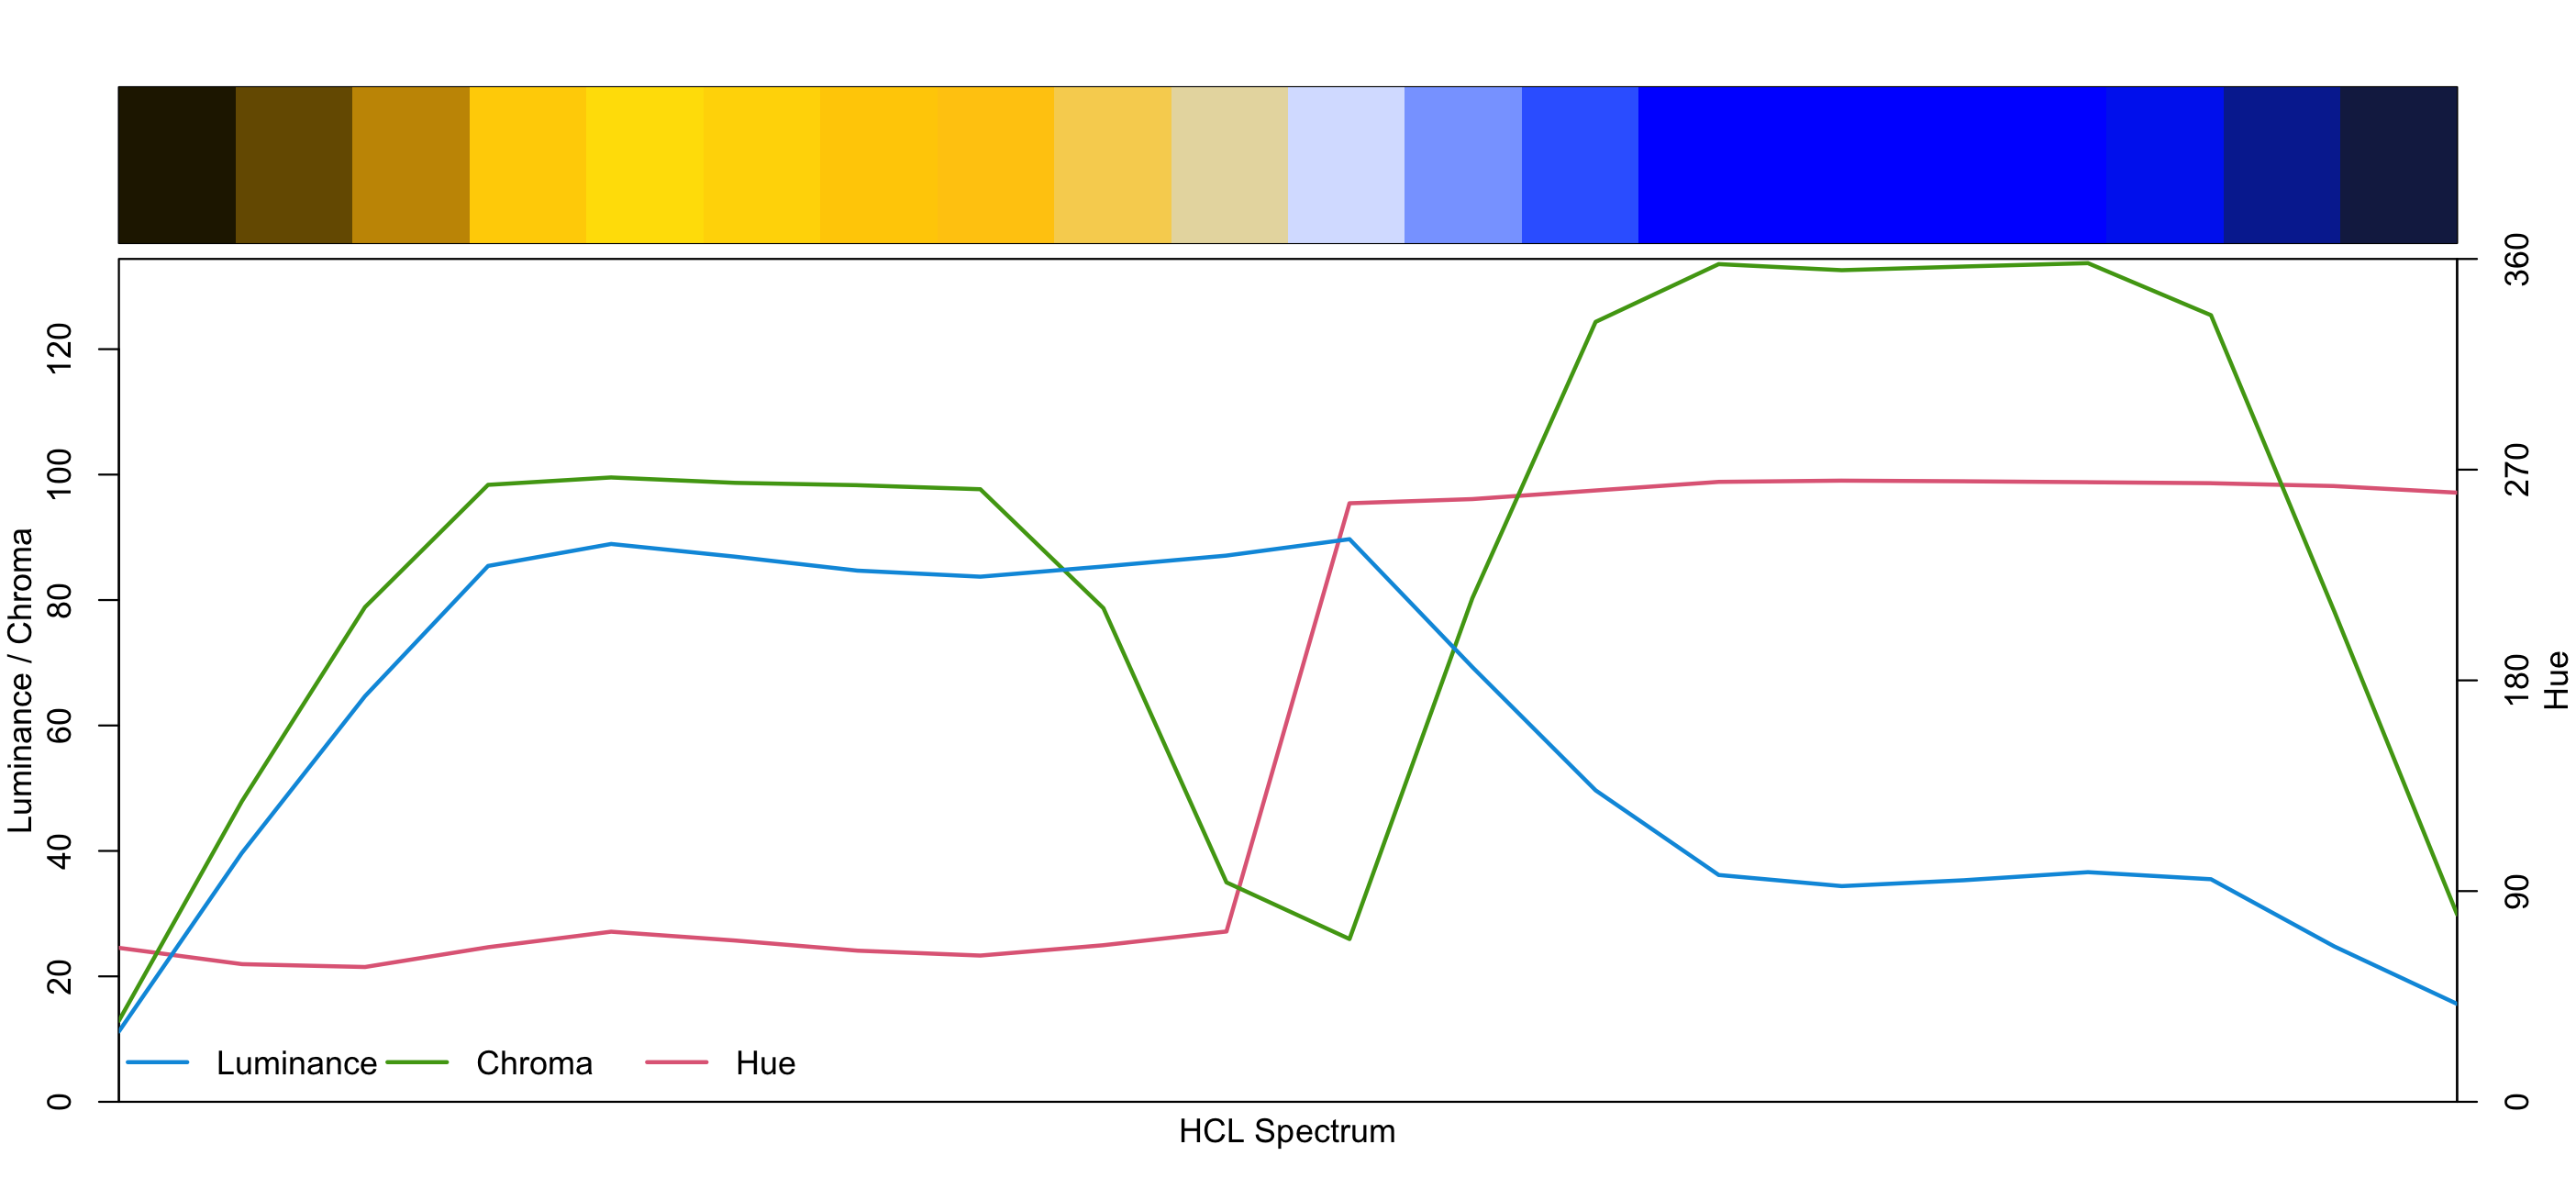
Explore rainbow palette with colorblindness specplot: Rainbow + protan + hclplot
rainbow(n = 20) %>% protan() %>% hclplot()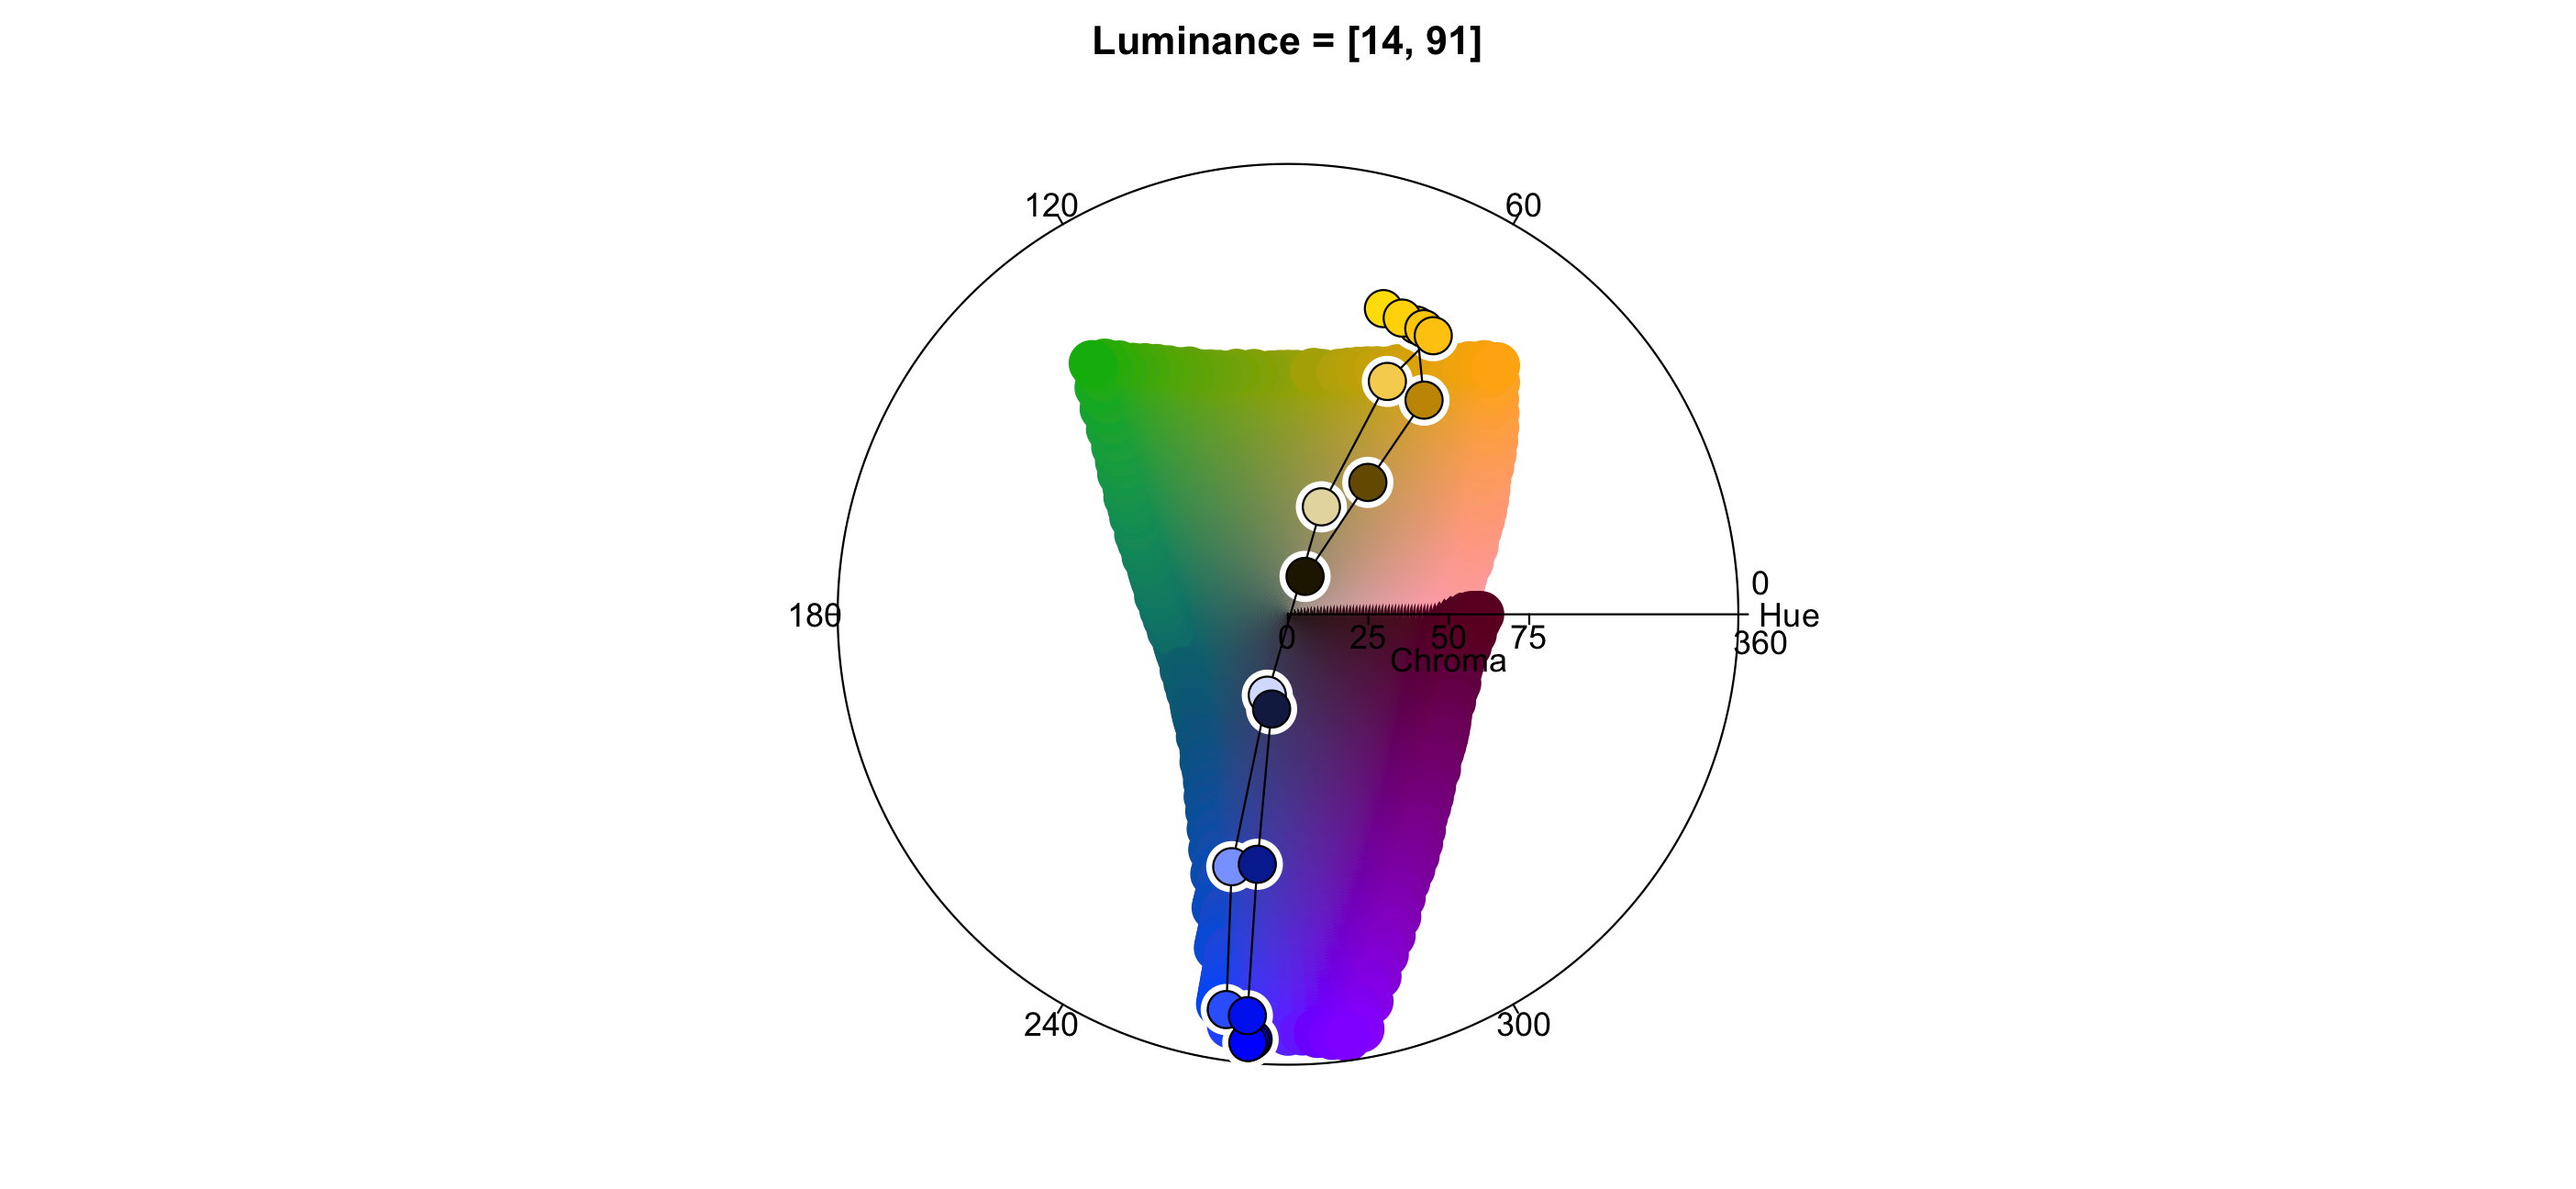
Explore palettes with specplot: Rainbow + demoplot
rainbow(n = 20) %>% demoplot()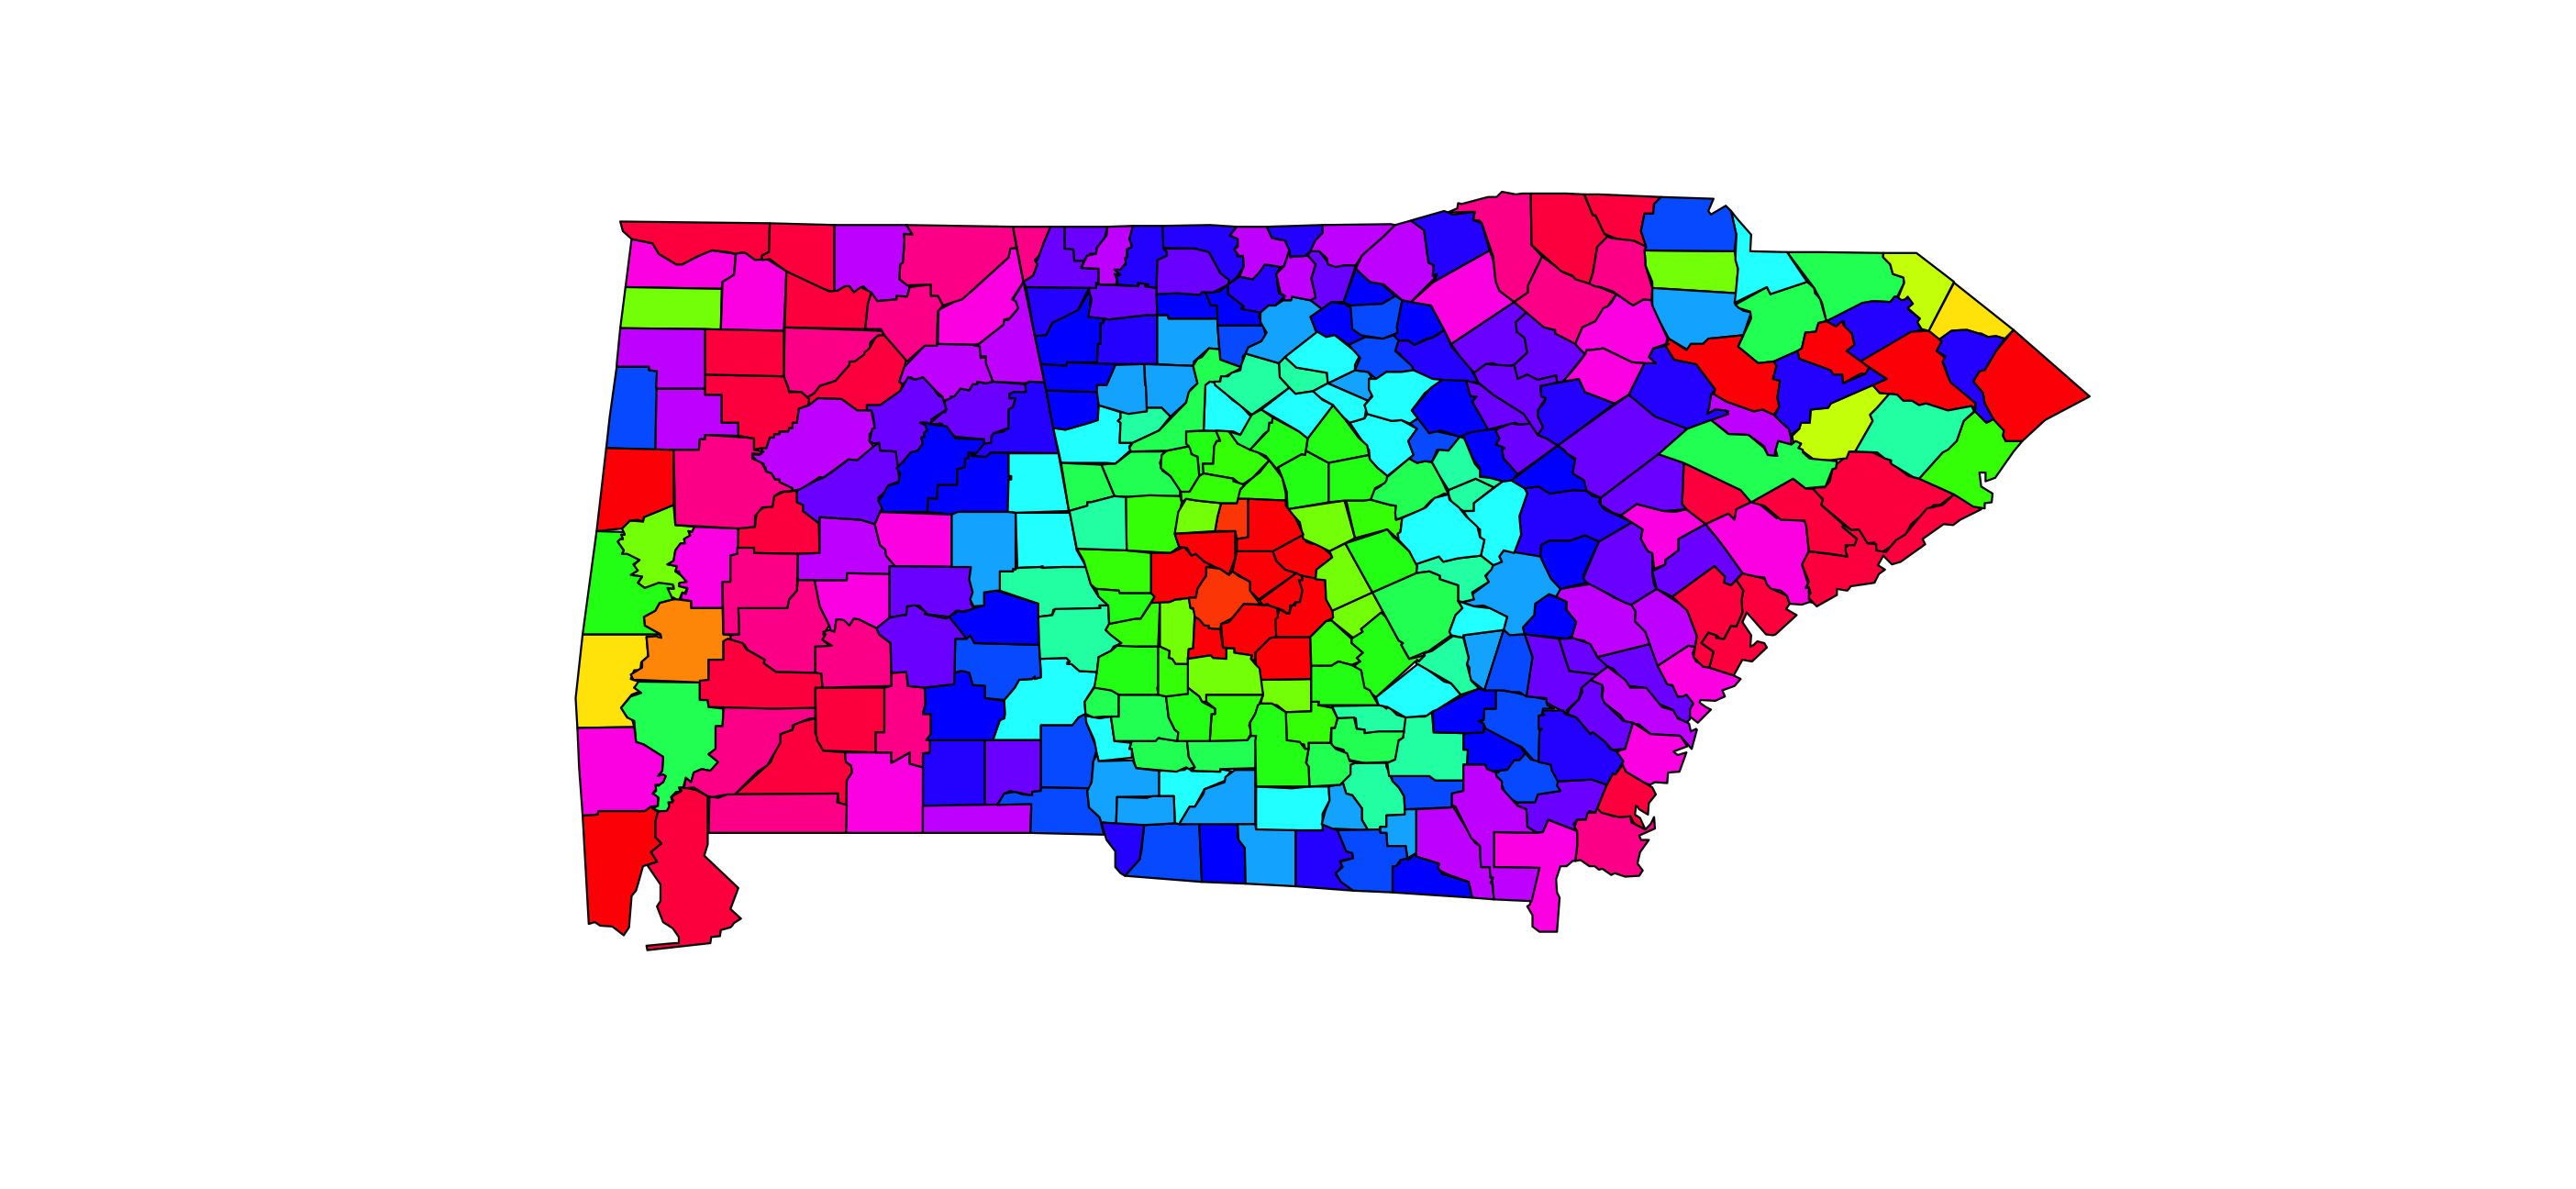
Explore palettes with specplot: Rainbow + protan + demoplot
rainbow(n = 20) %>% protan() %>% demoplot()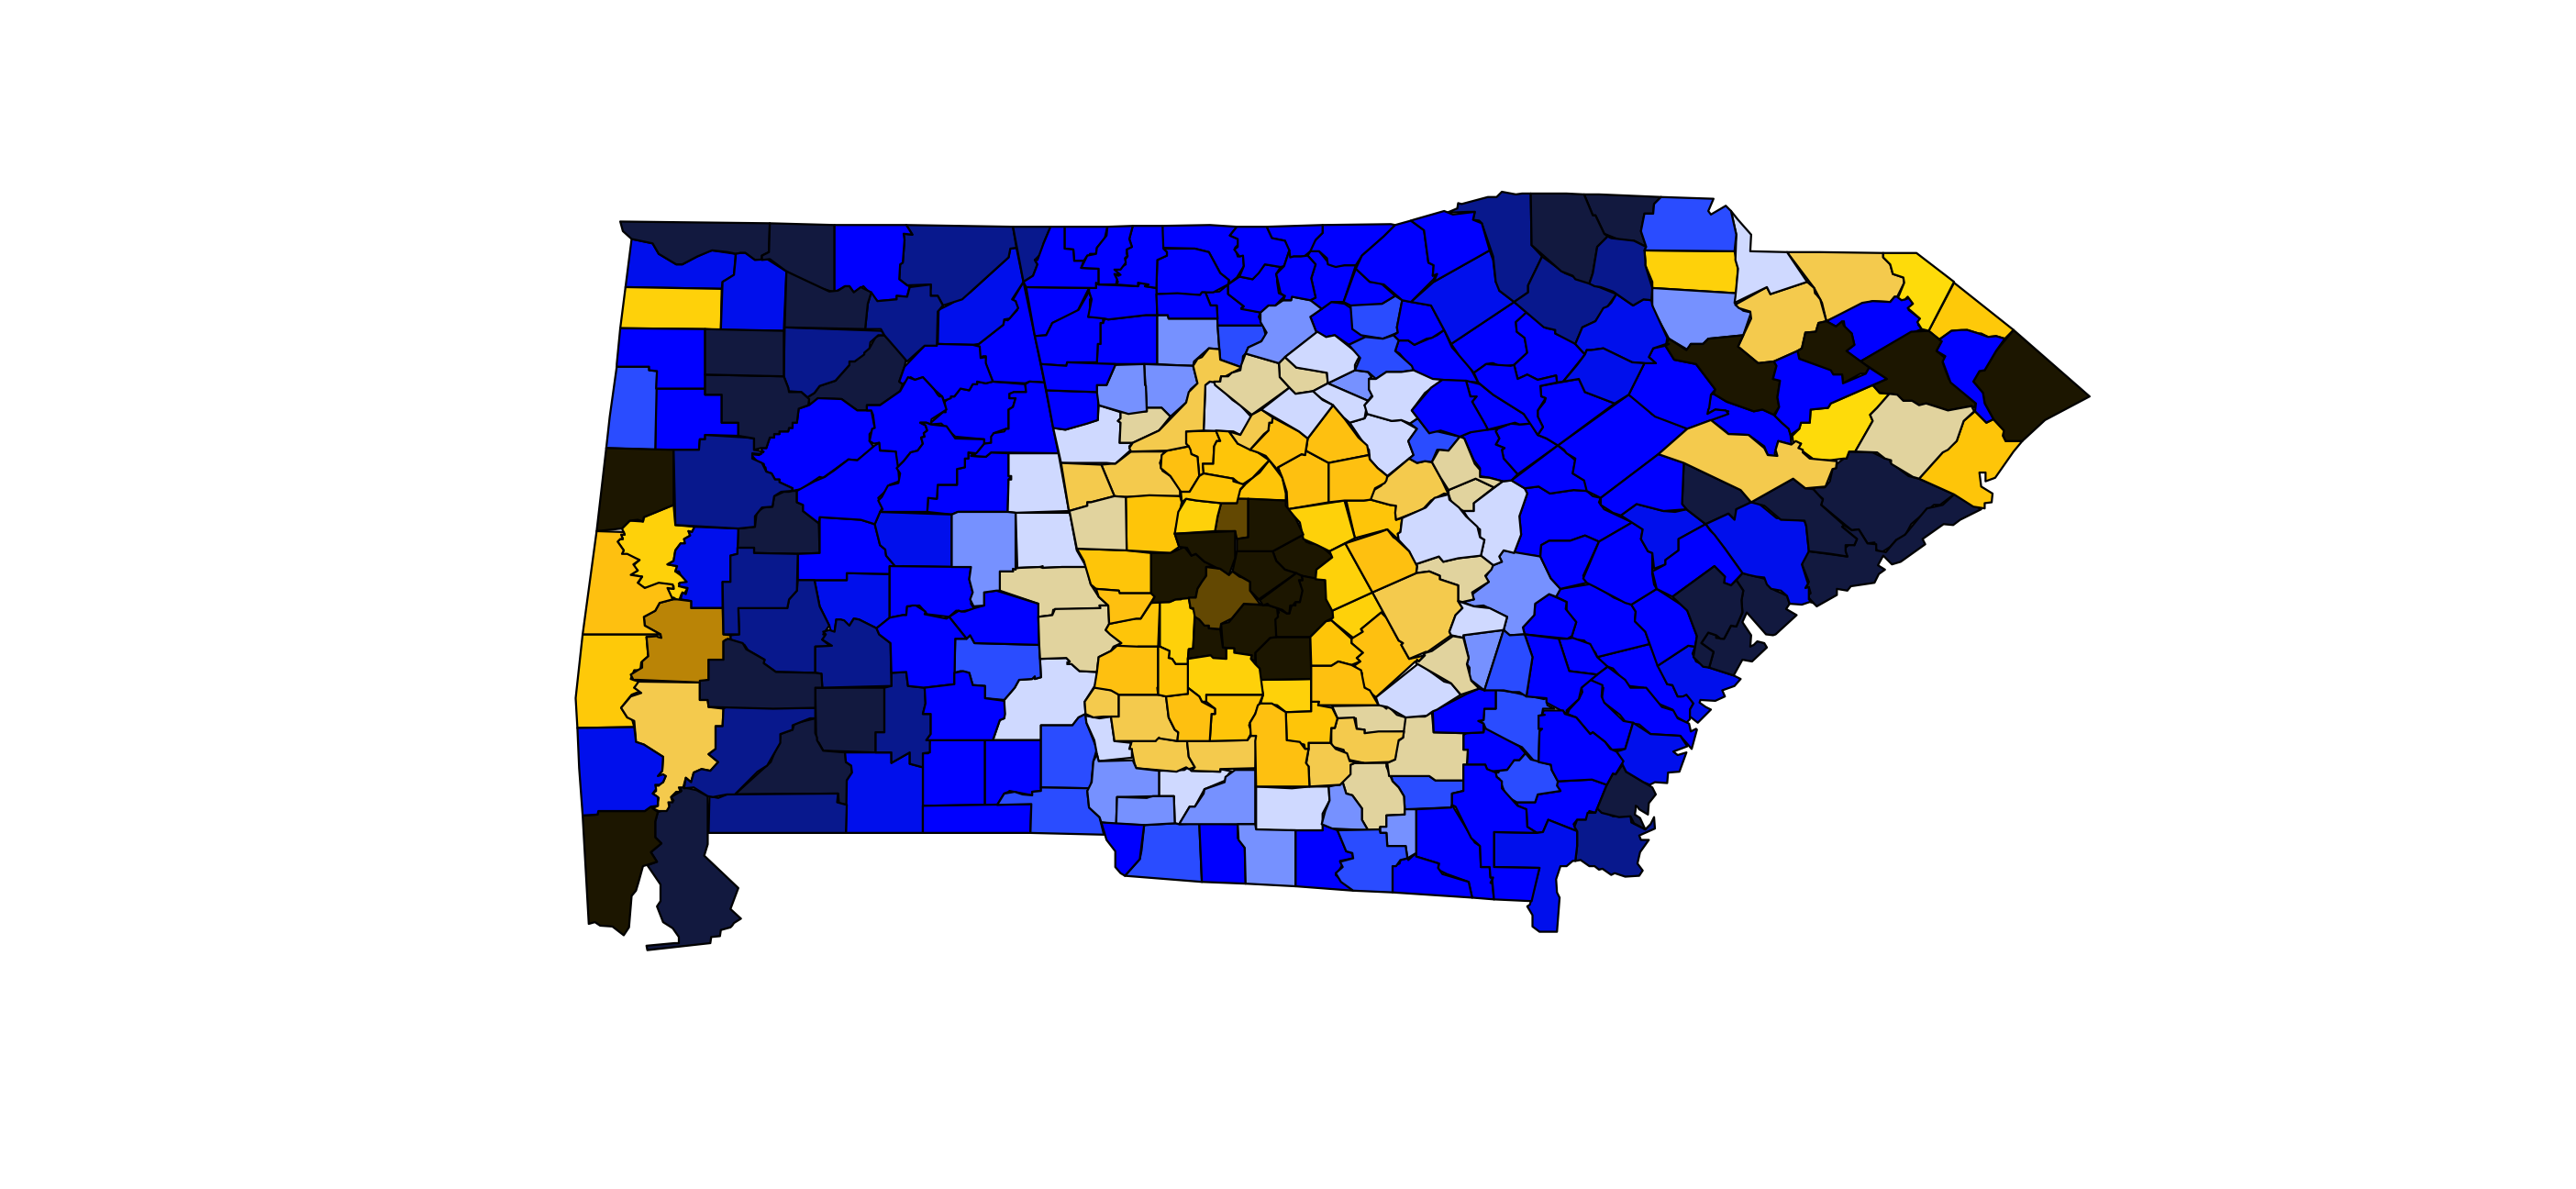
Compare Rainbow to Viridis: specplot
rainbow(n = 20) %>% specplot()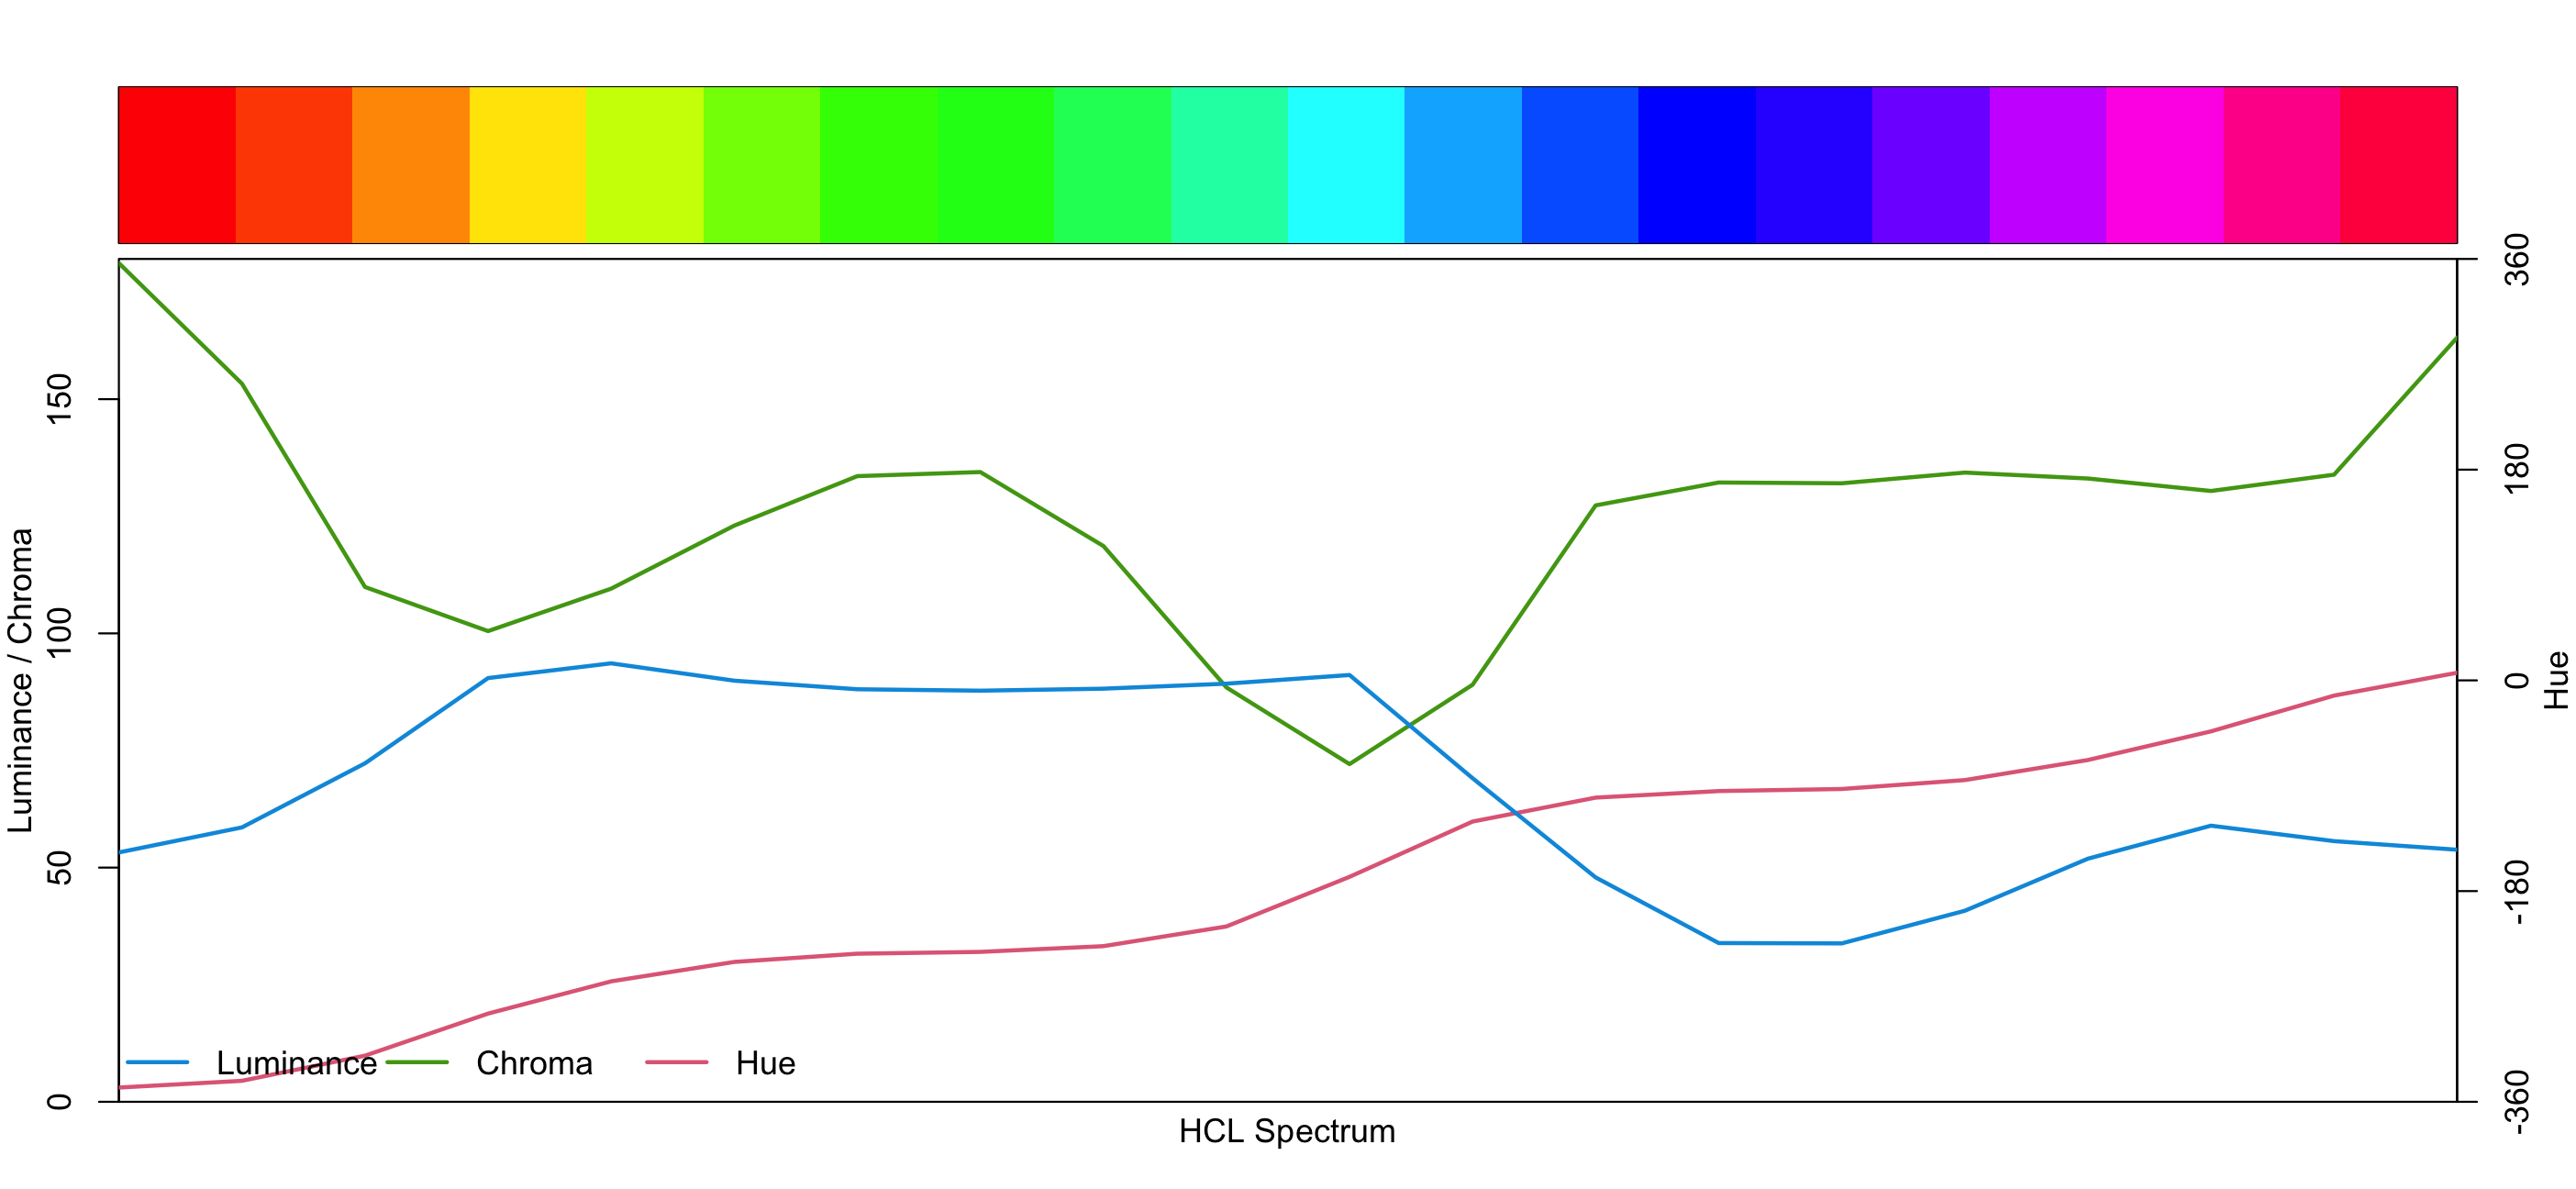
pals::viridis(n = 20) %>% specplot()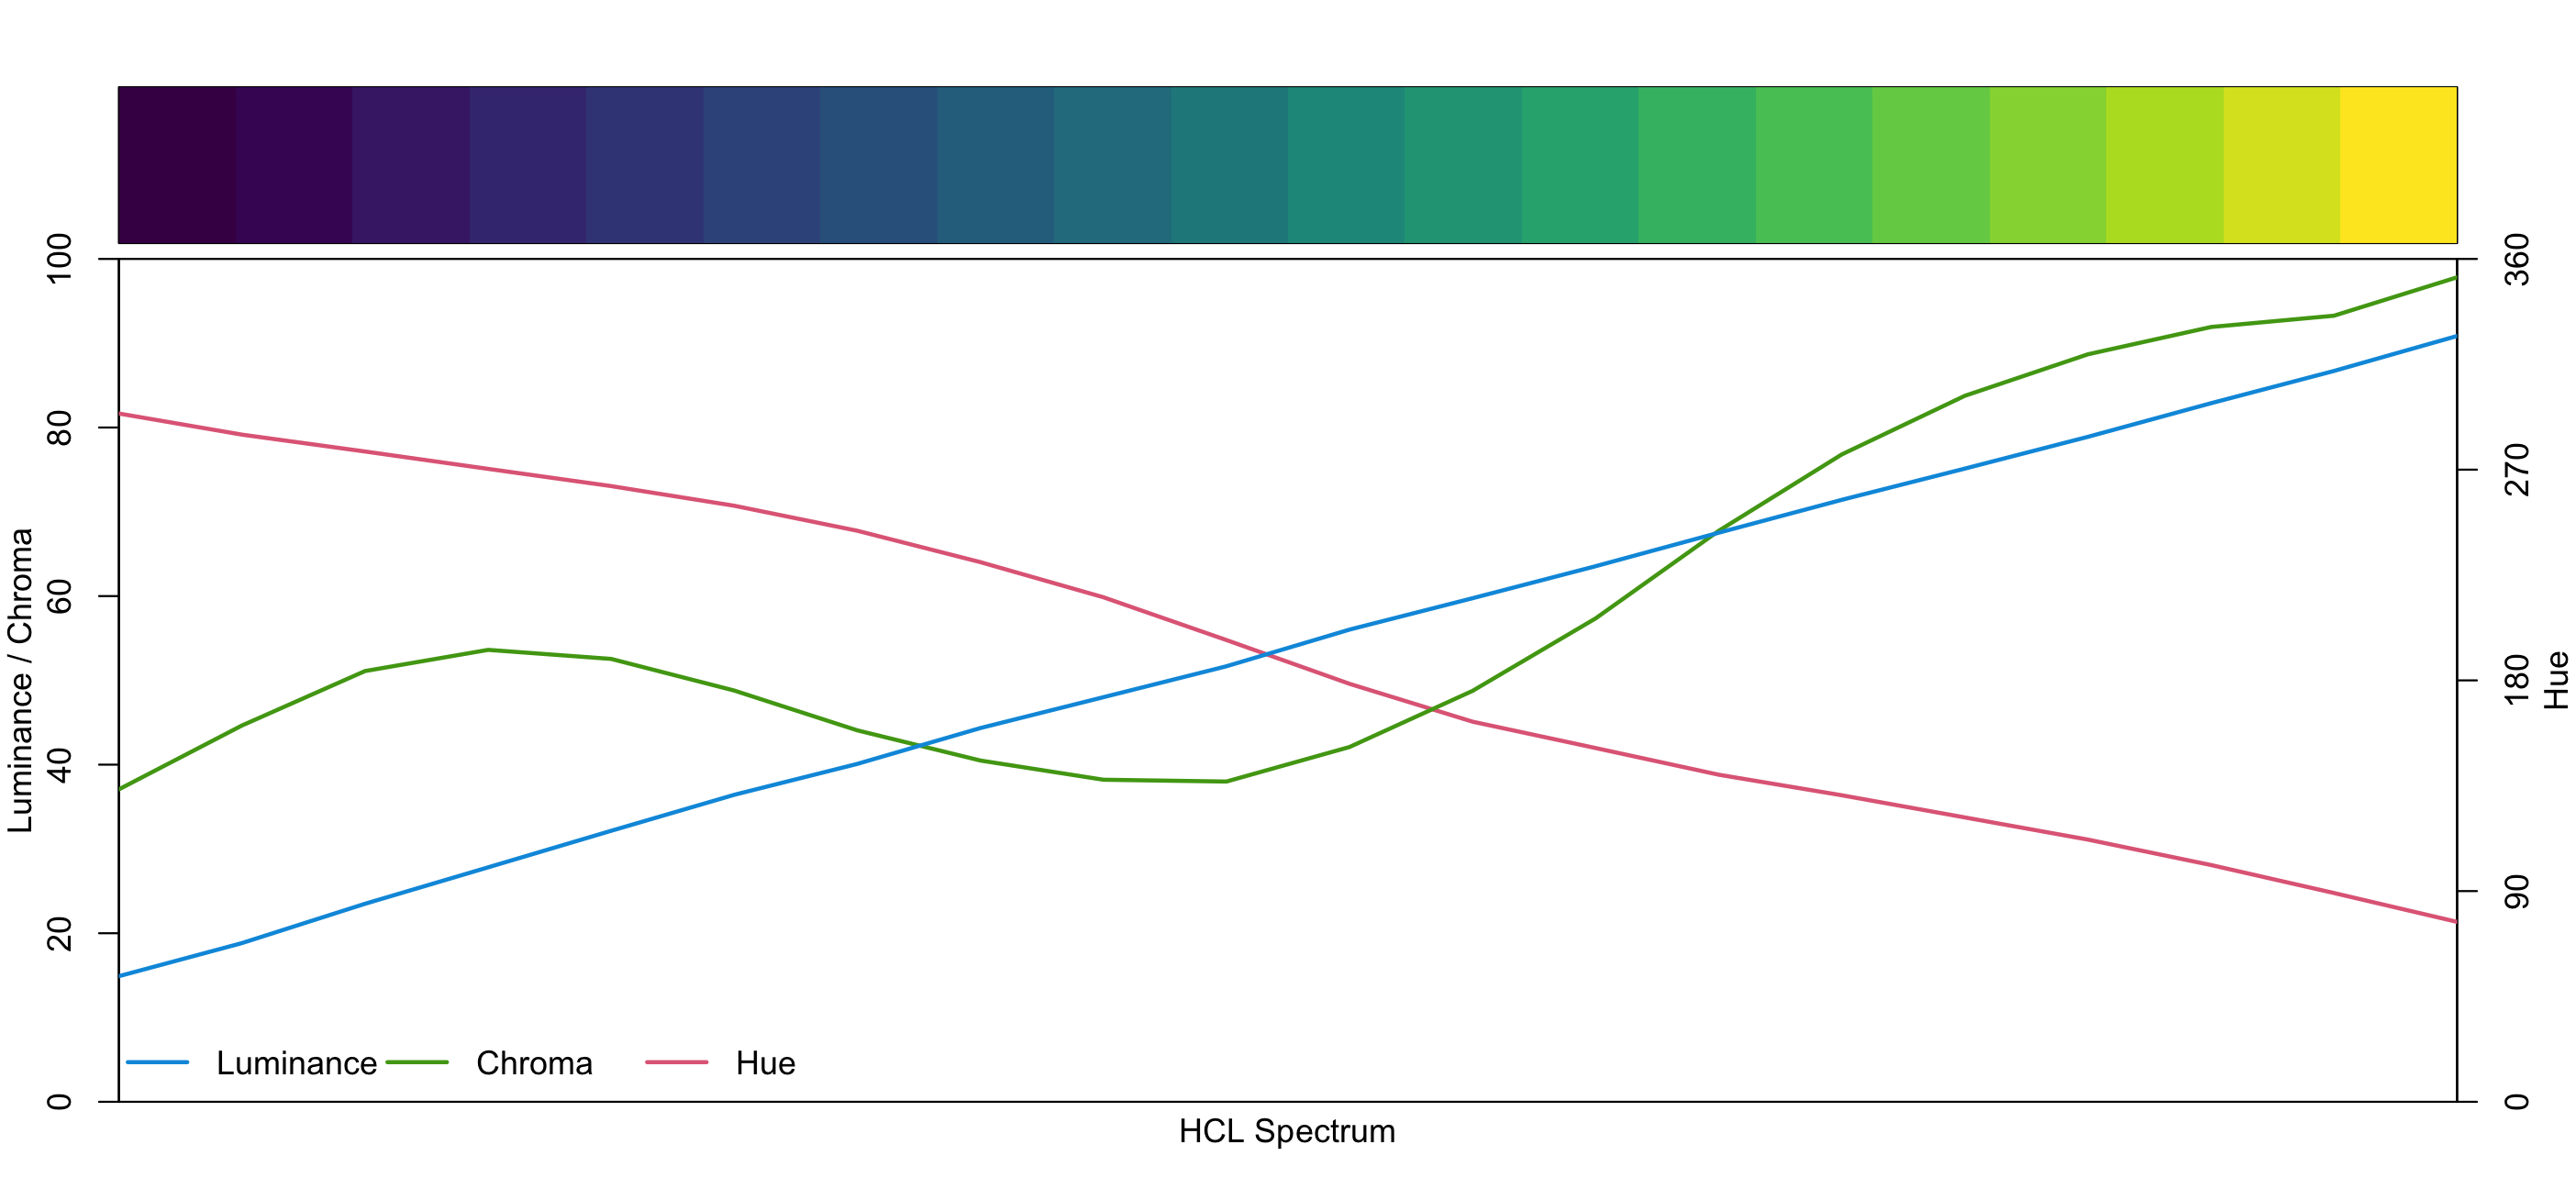
Compare Rainbow to Viridis: specplot + protan
rainbow(n = 20) %>% protan() %>% specplot()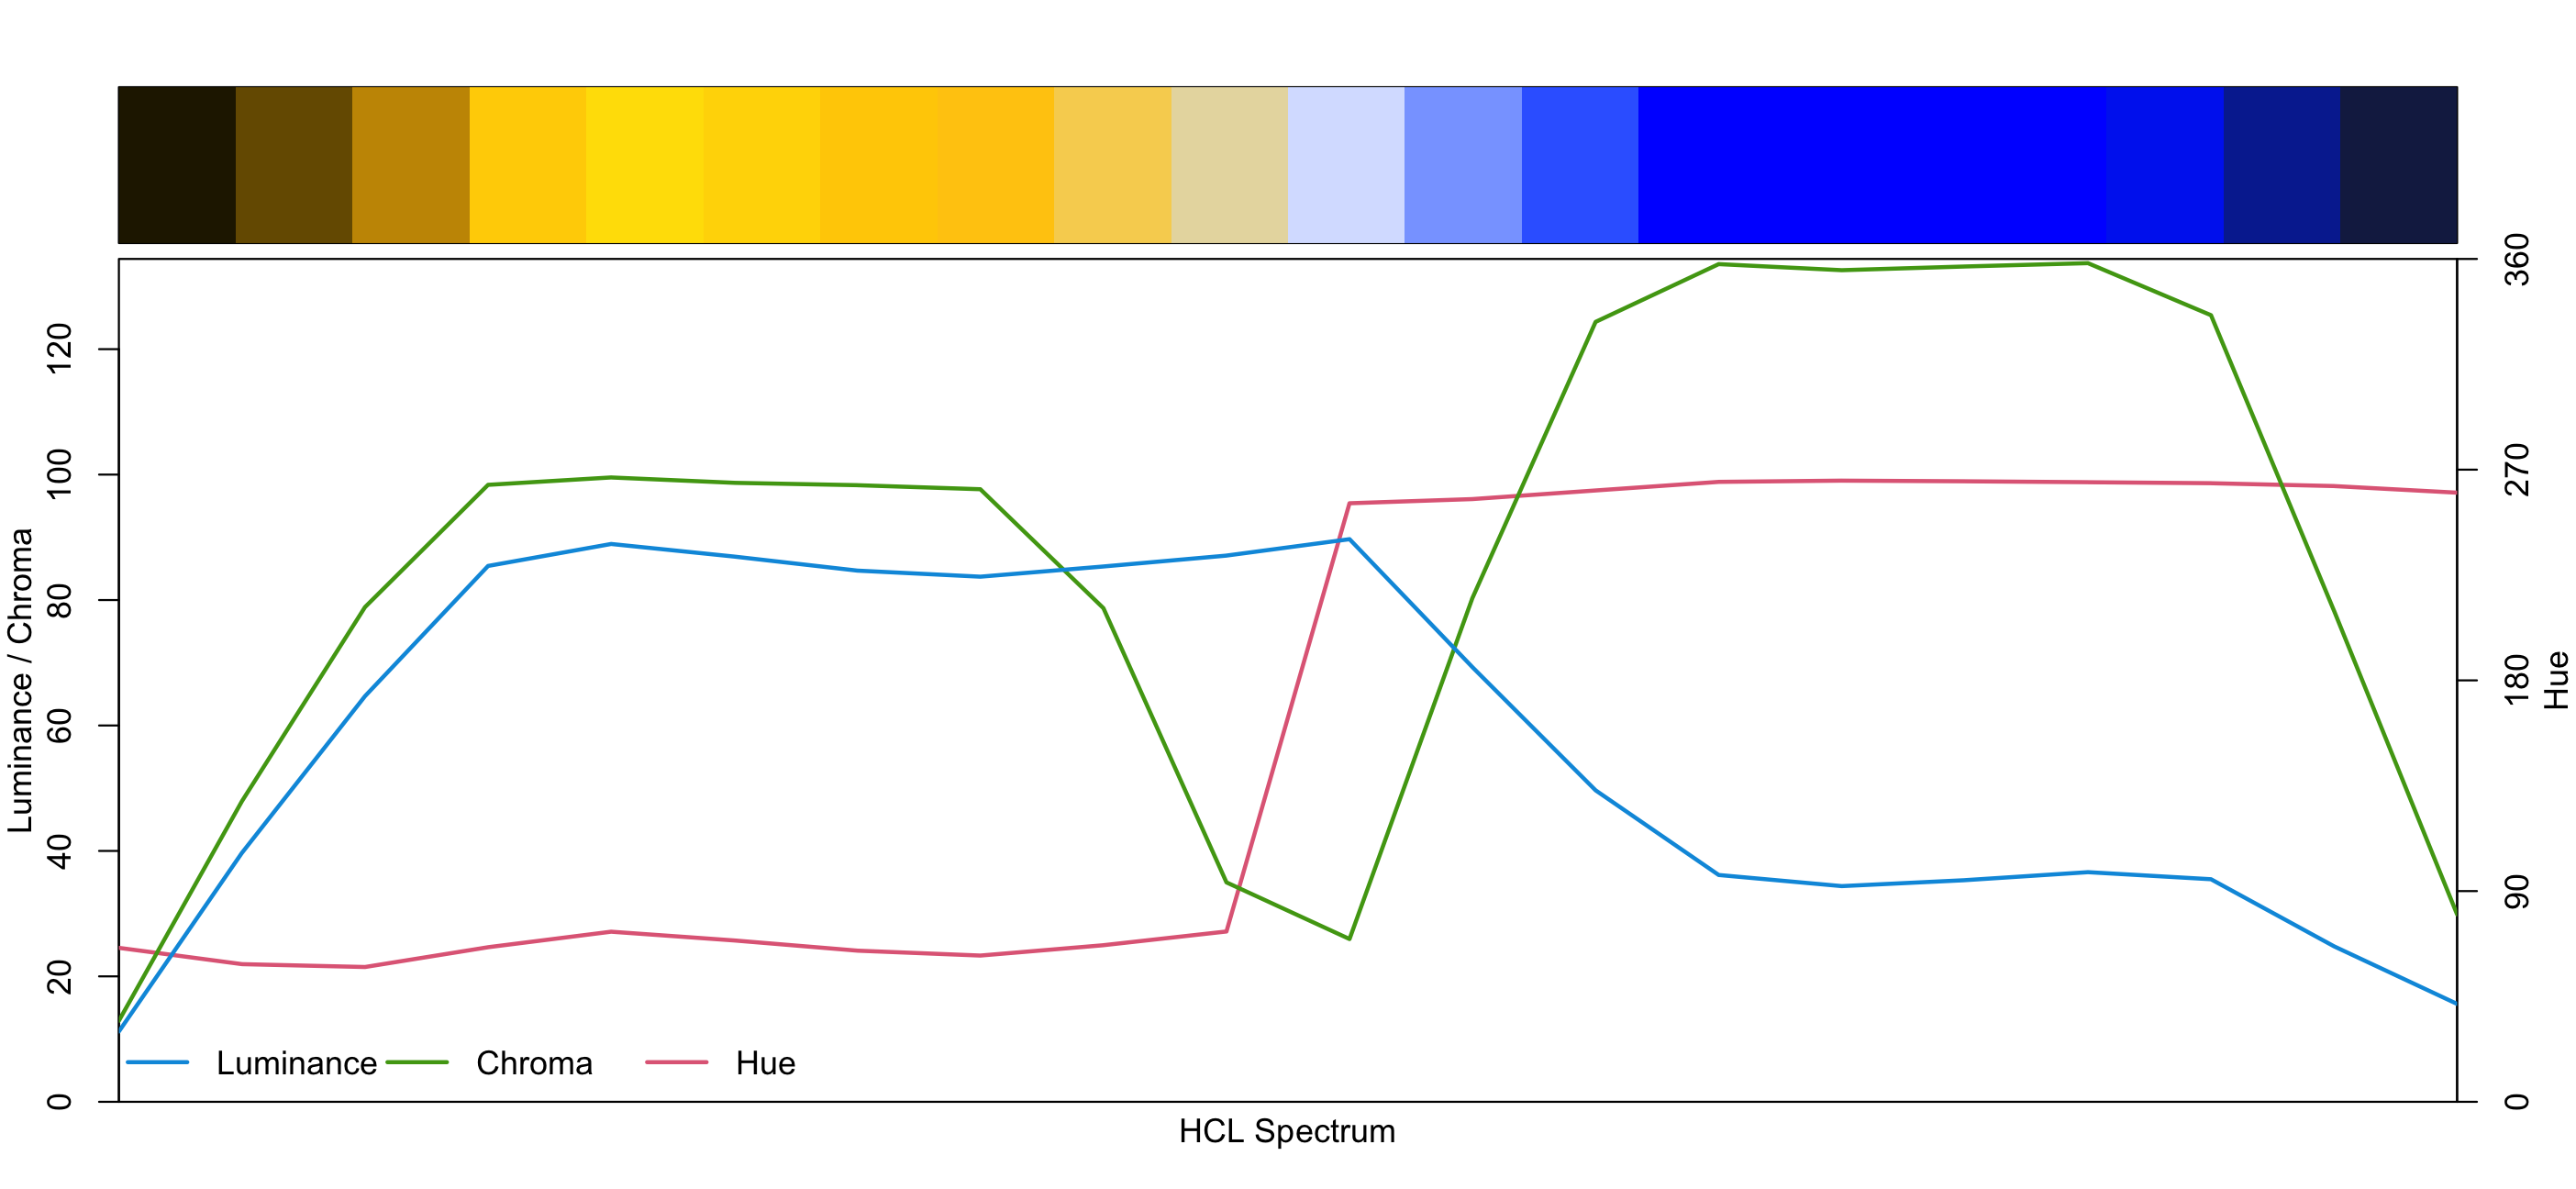
pals::viridis(n = 20) %>% protan() %>% specplot()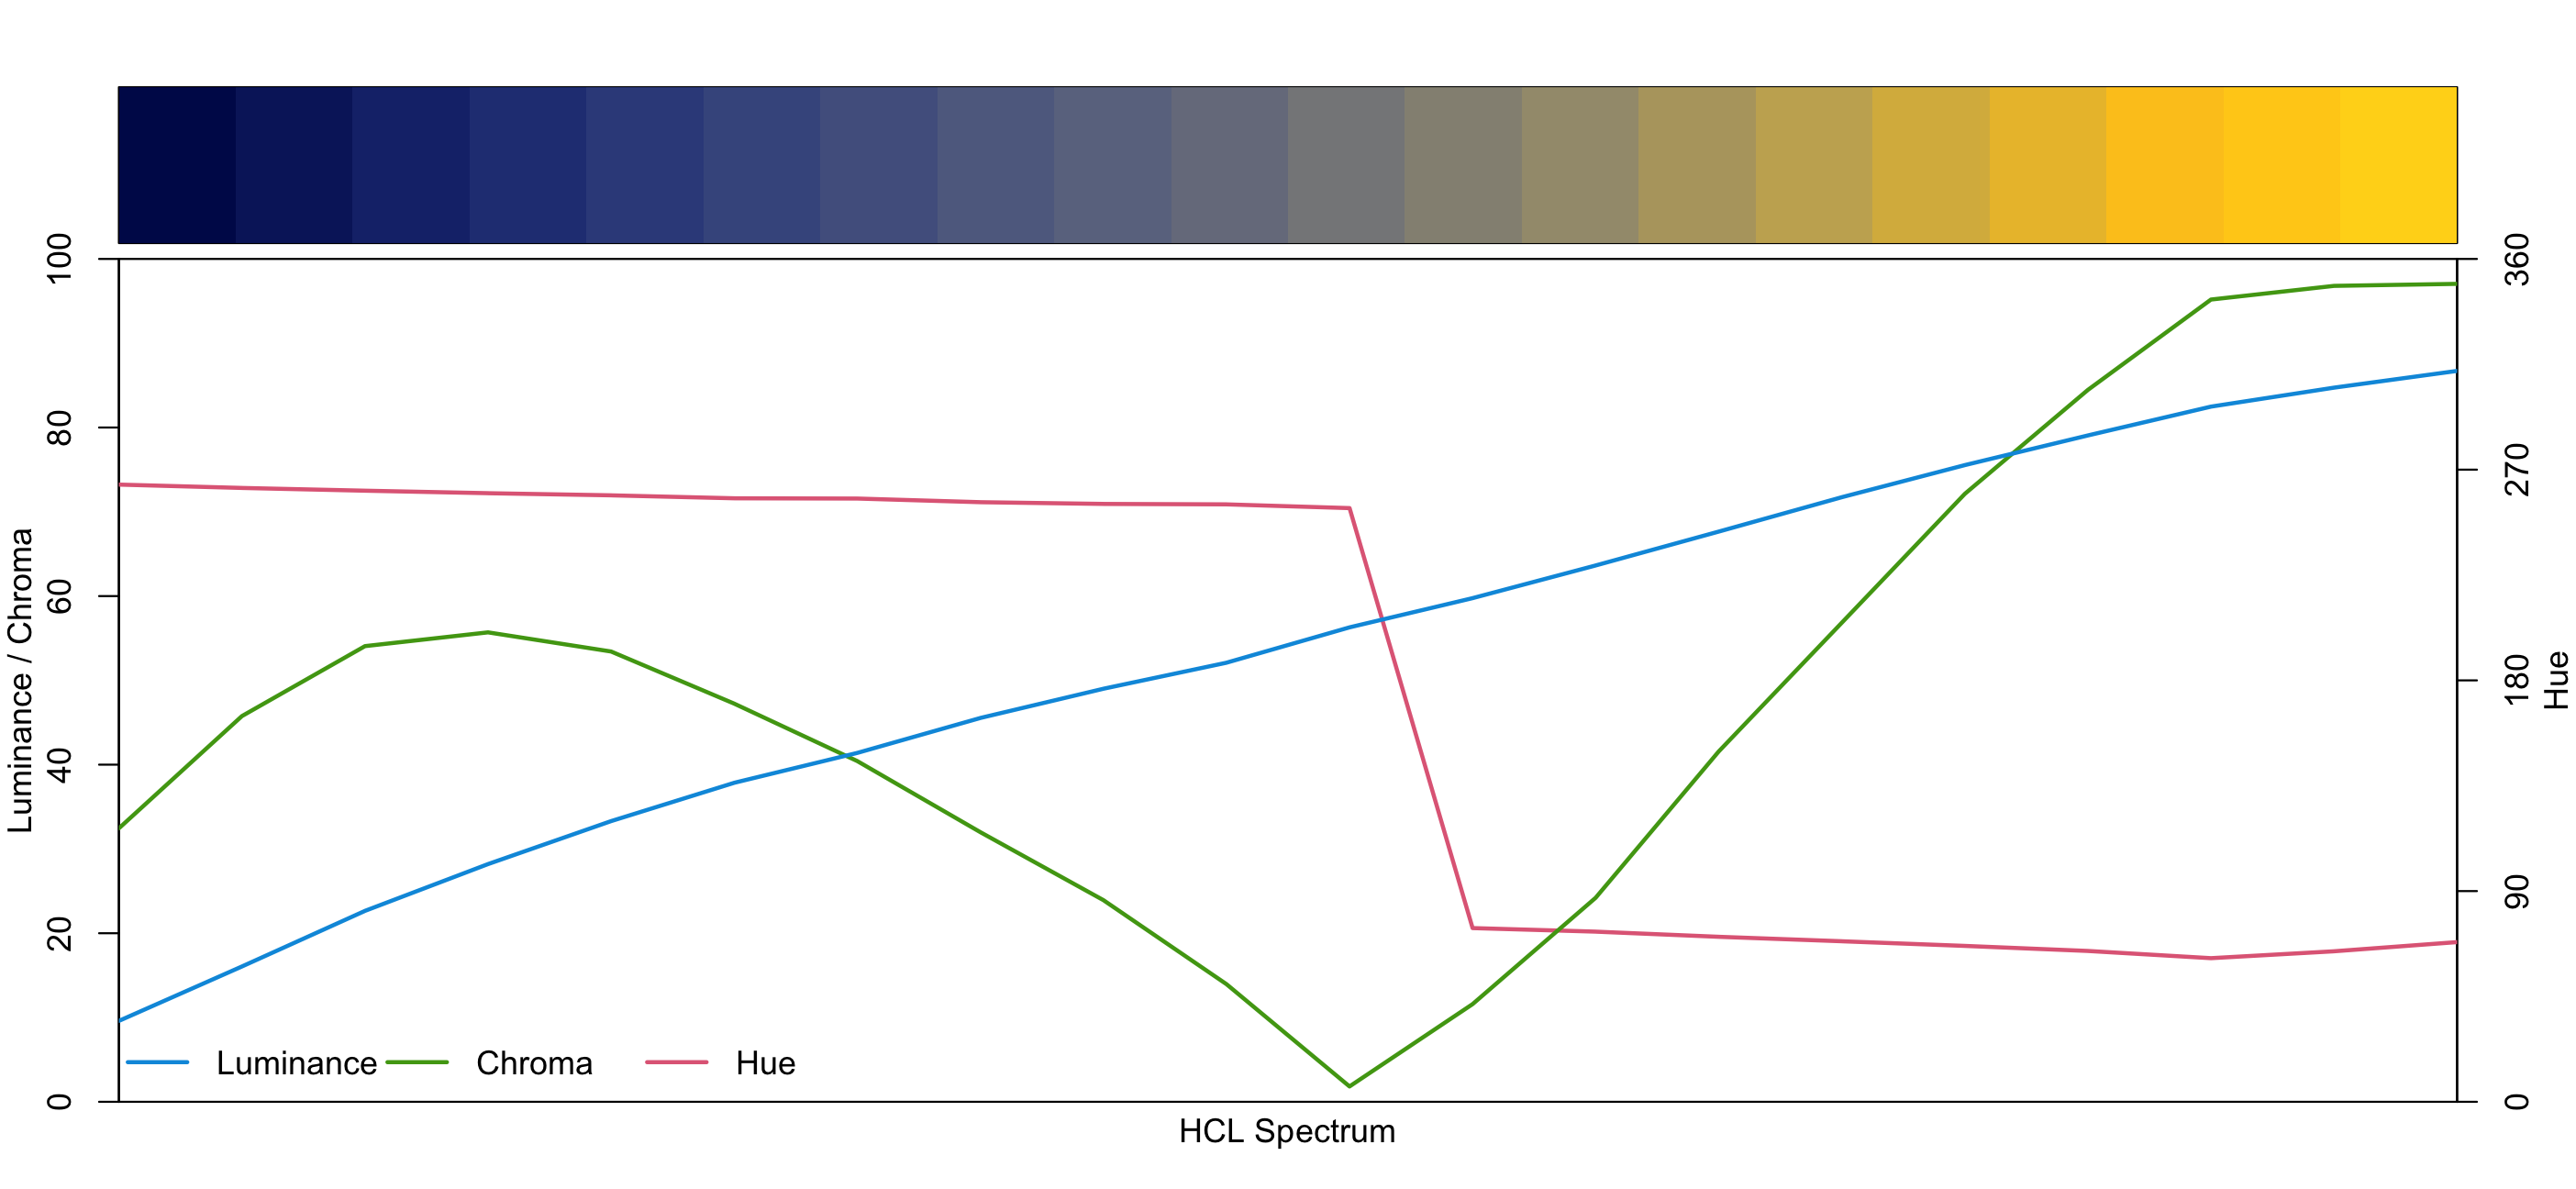
Compare Rainbow to Viridis: hclplot
rainbow(n = 20) %>% hclplot()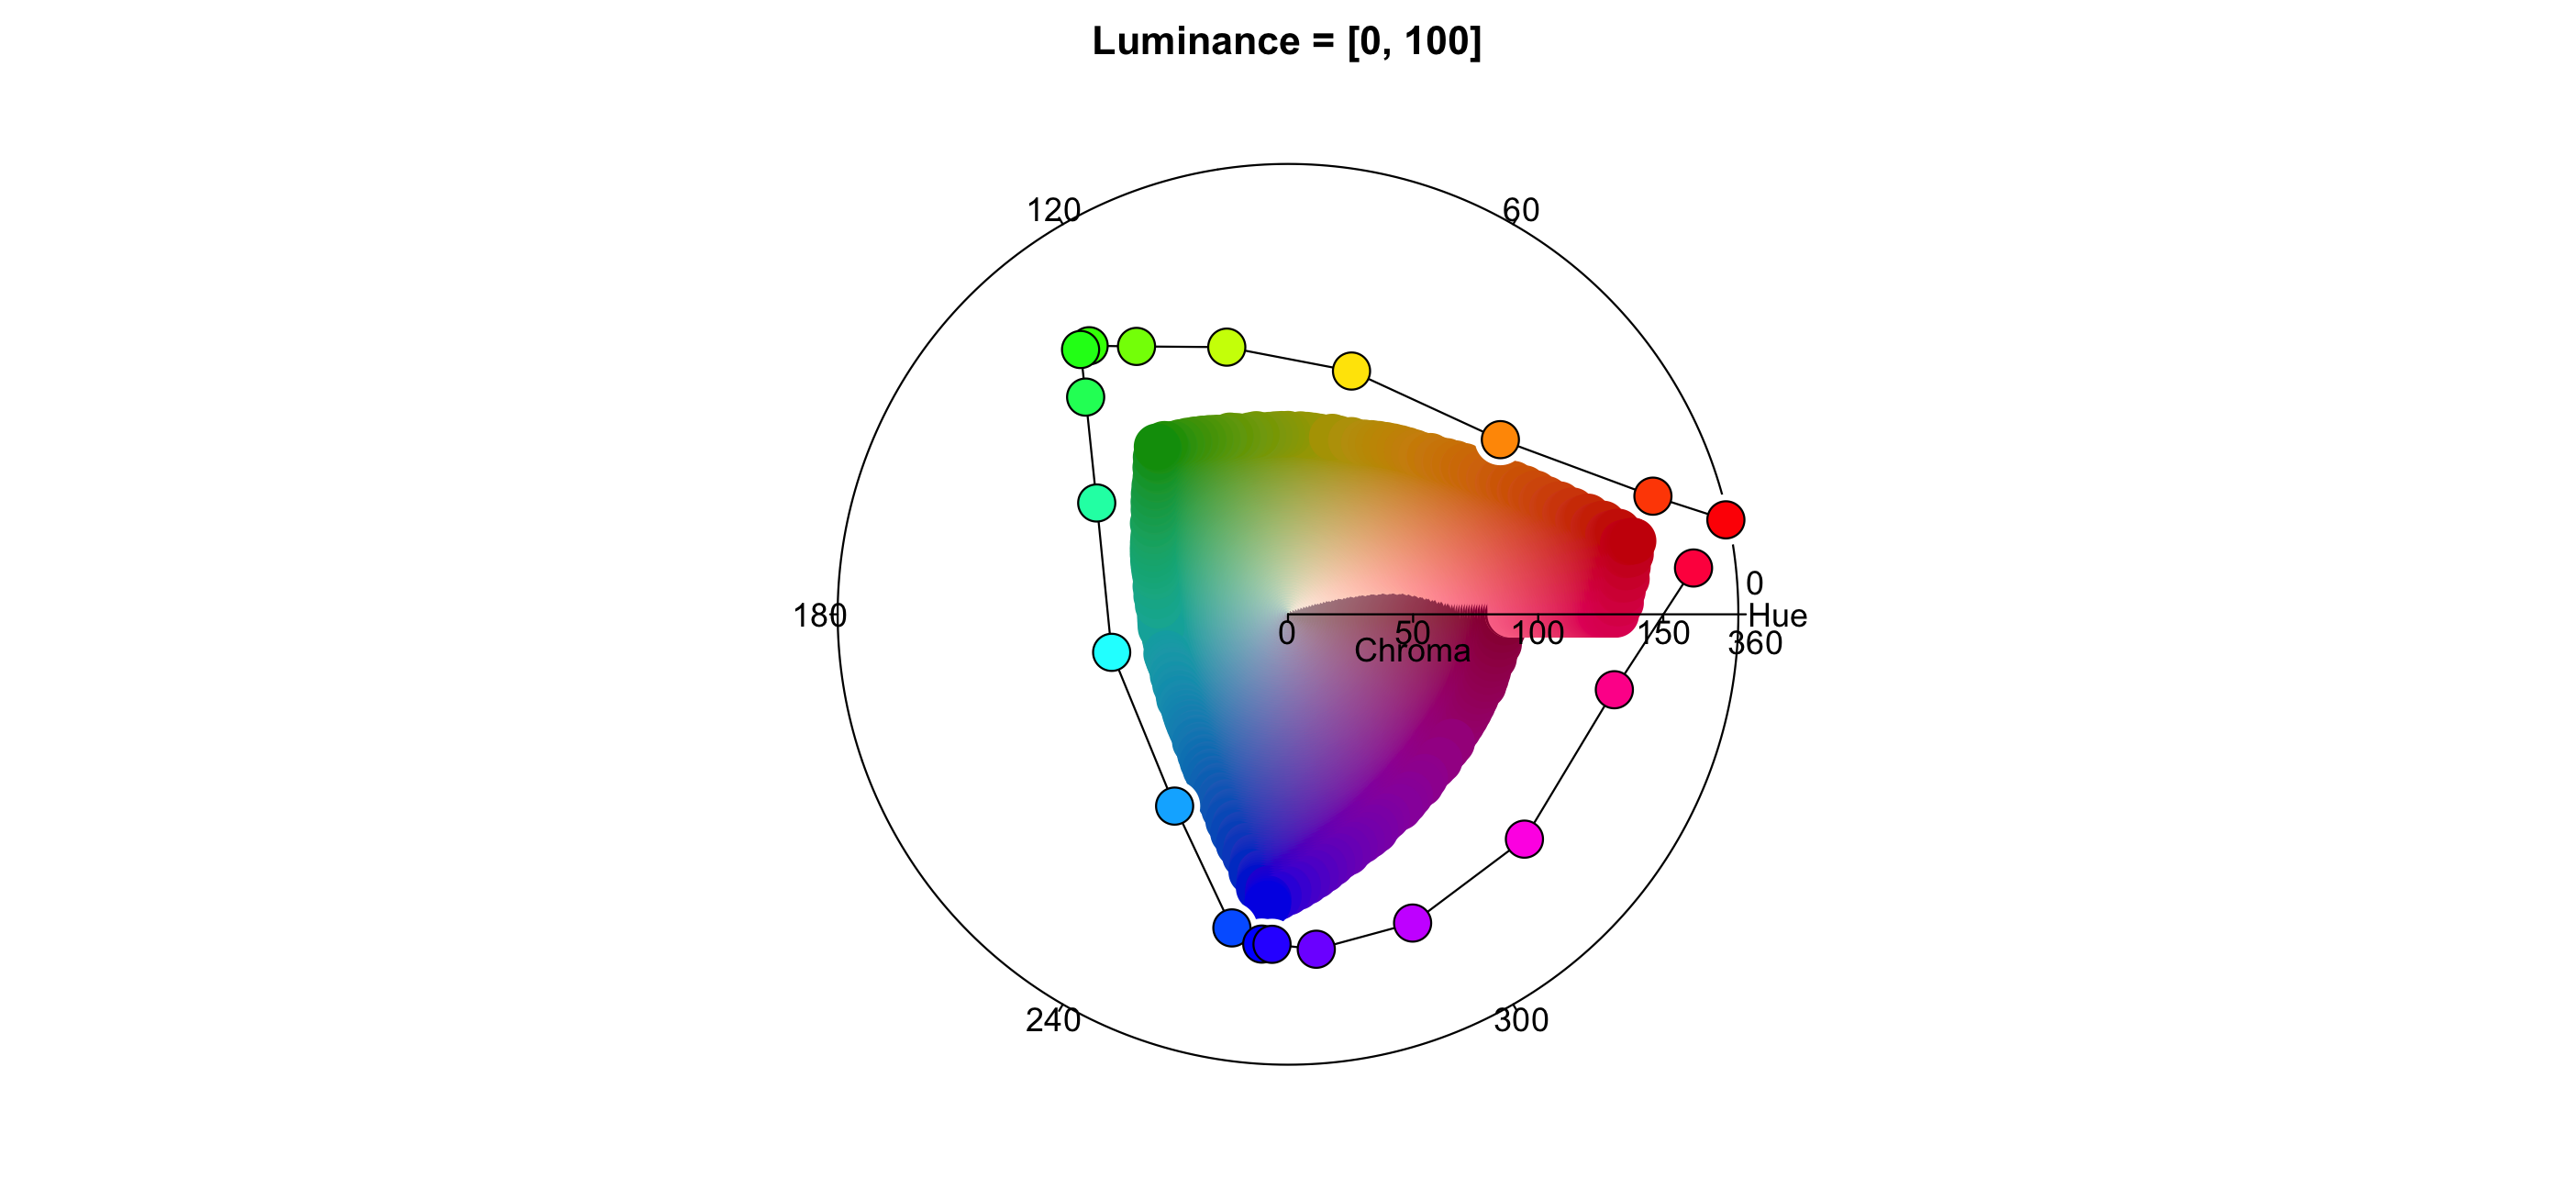
pals::viridis(n = 20) %>% hclplot()
Compare Rainbow to Viridis: hclplot + protan
rainbow(n = 20) %>% protan() %>% hclplot()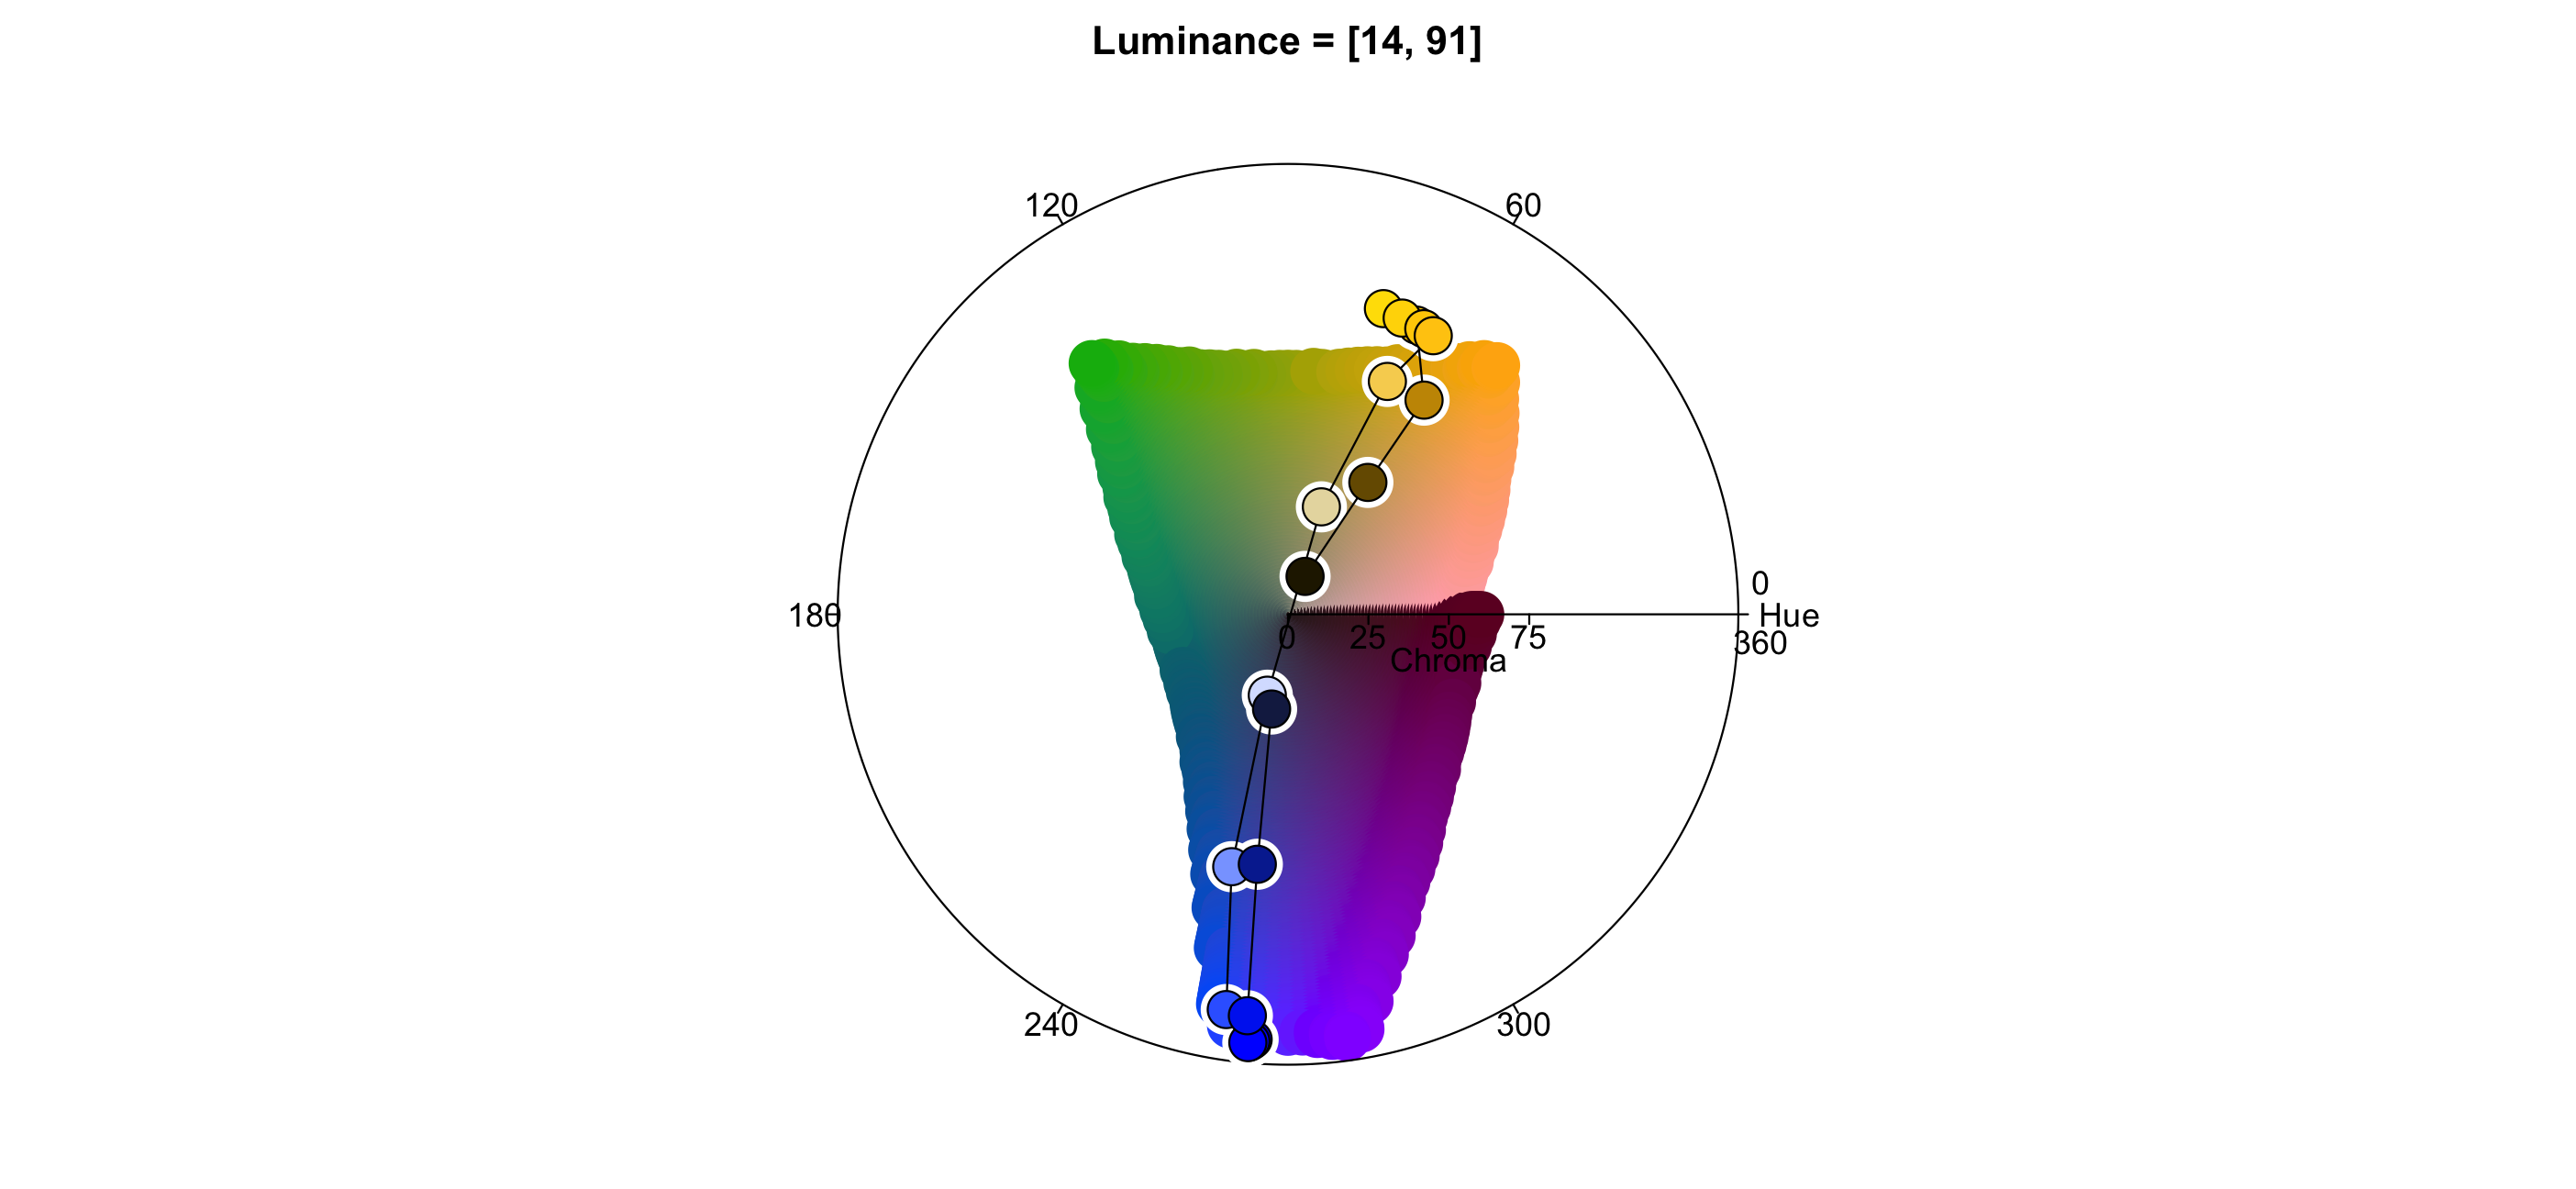
pals::viridis(n = 20) %>% protan() %>% hclplot()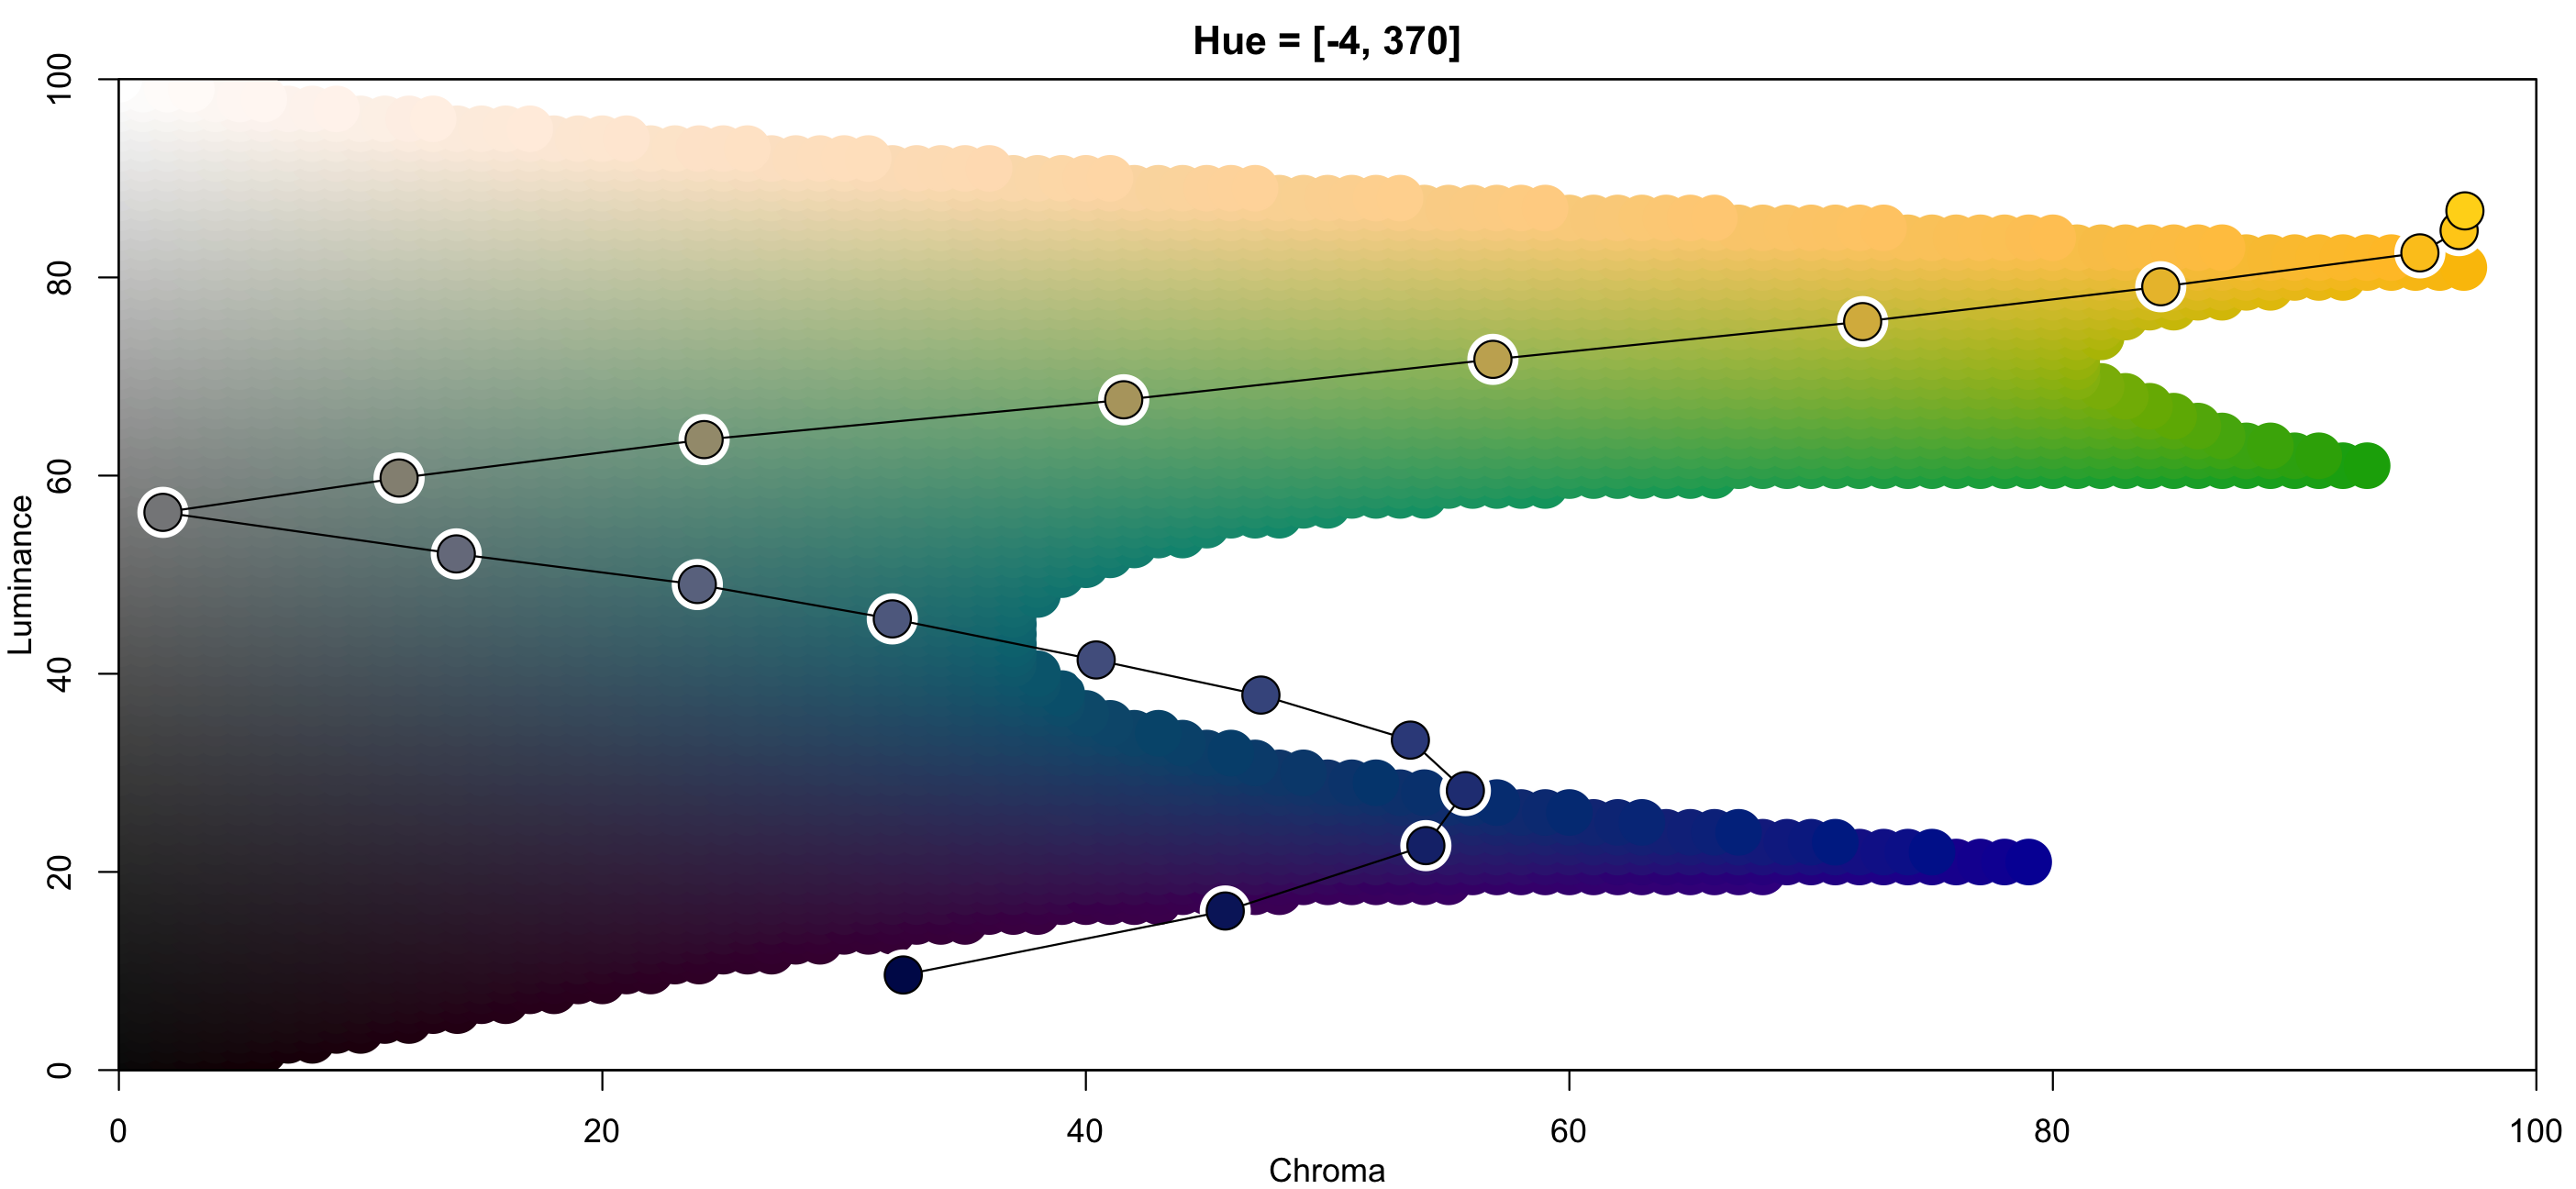
Compare Rainbow to Viridis: demoplot
rainbow(n = 20) %>% demoplot()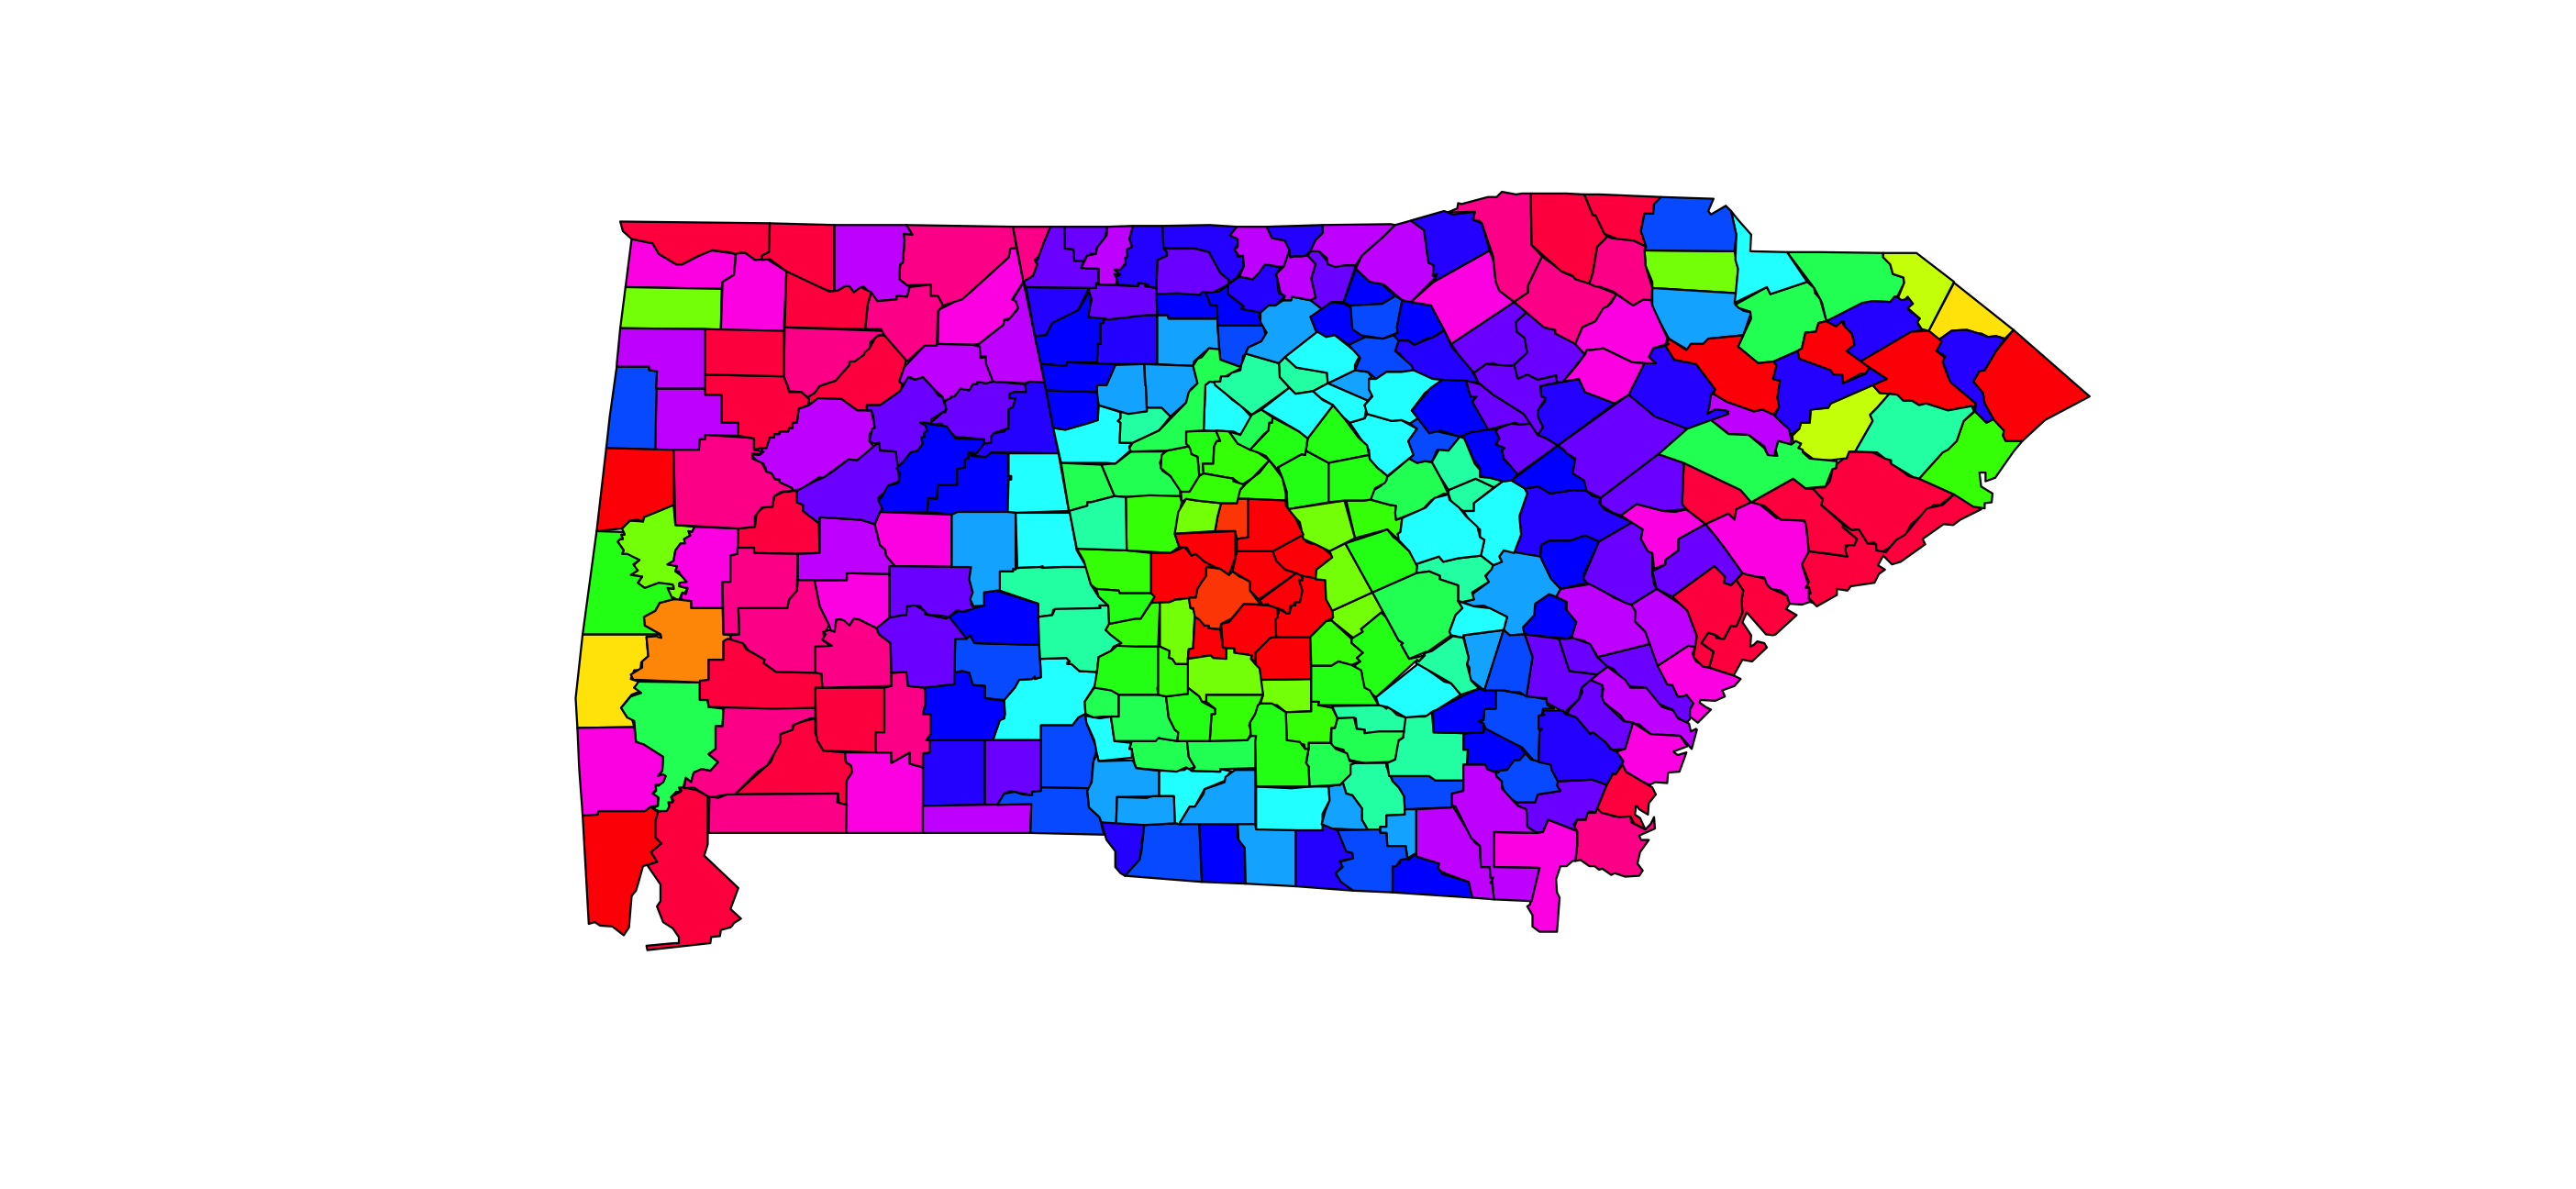
pals::viridis(n = 20) %>% demoplot()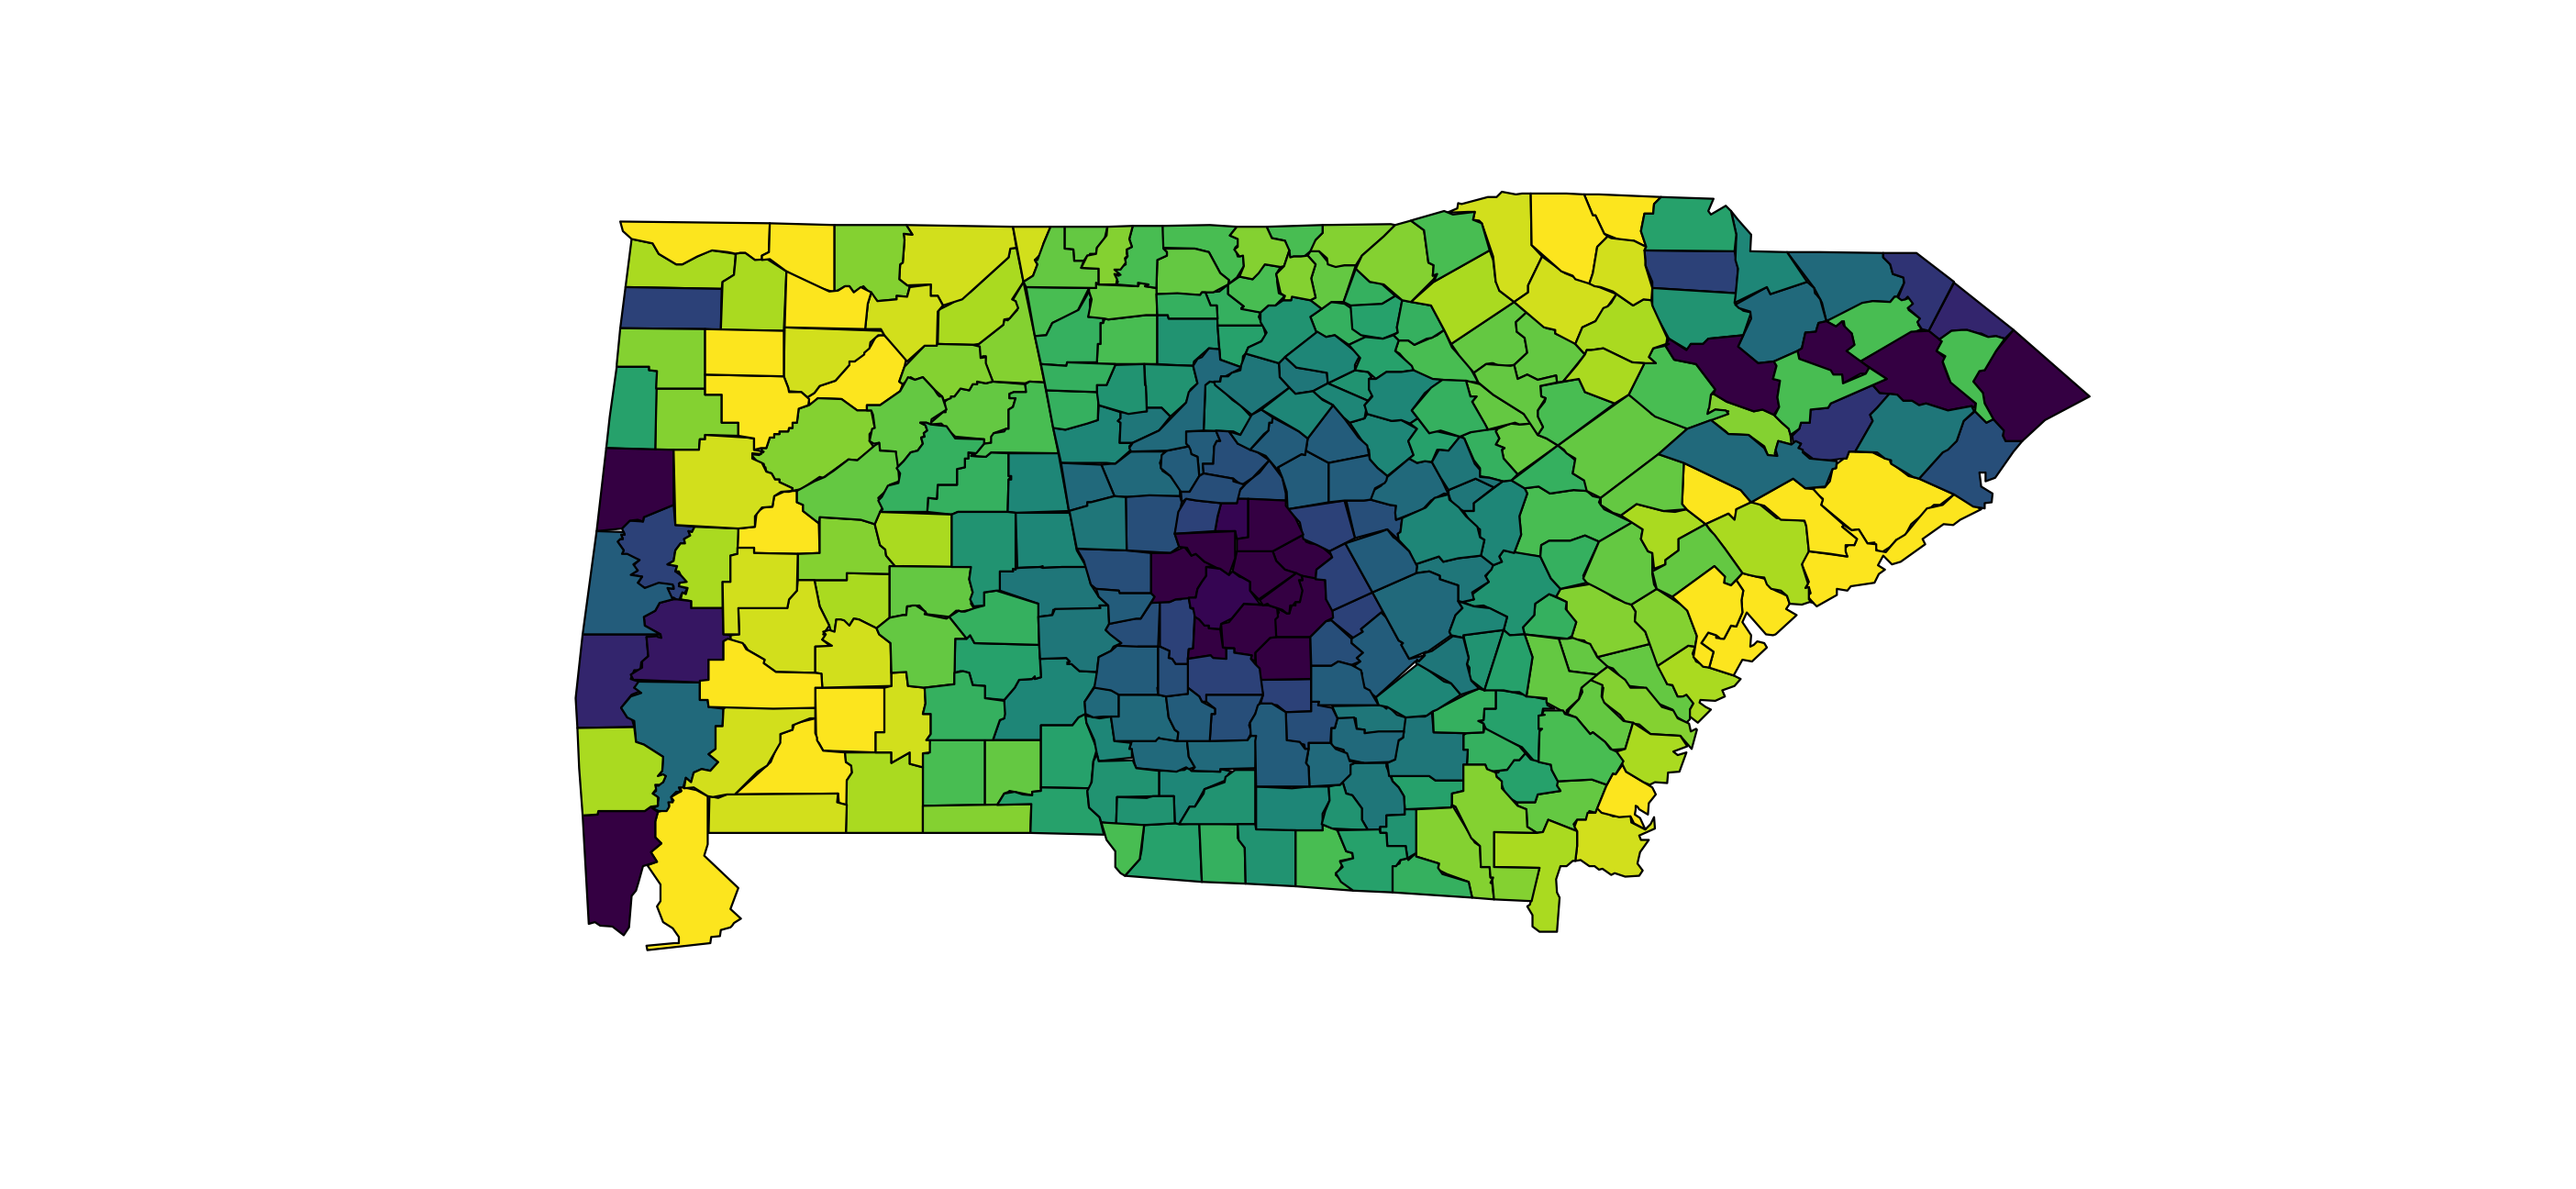
Compare Rainbow to Viridis: demoplot + protan
rainbow(n = 20) %>% protan() %>% demoplot()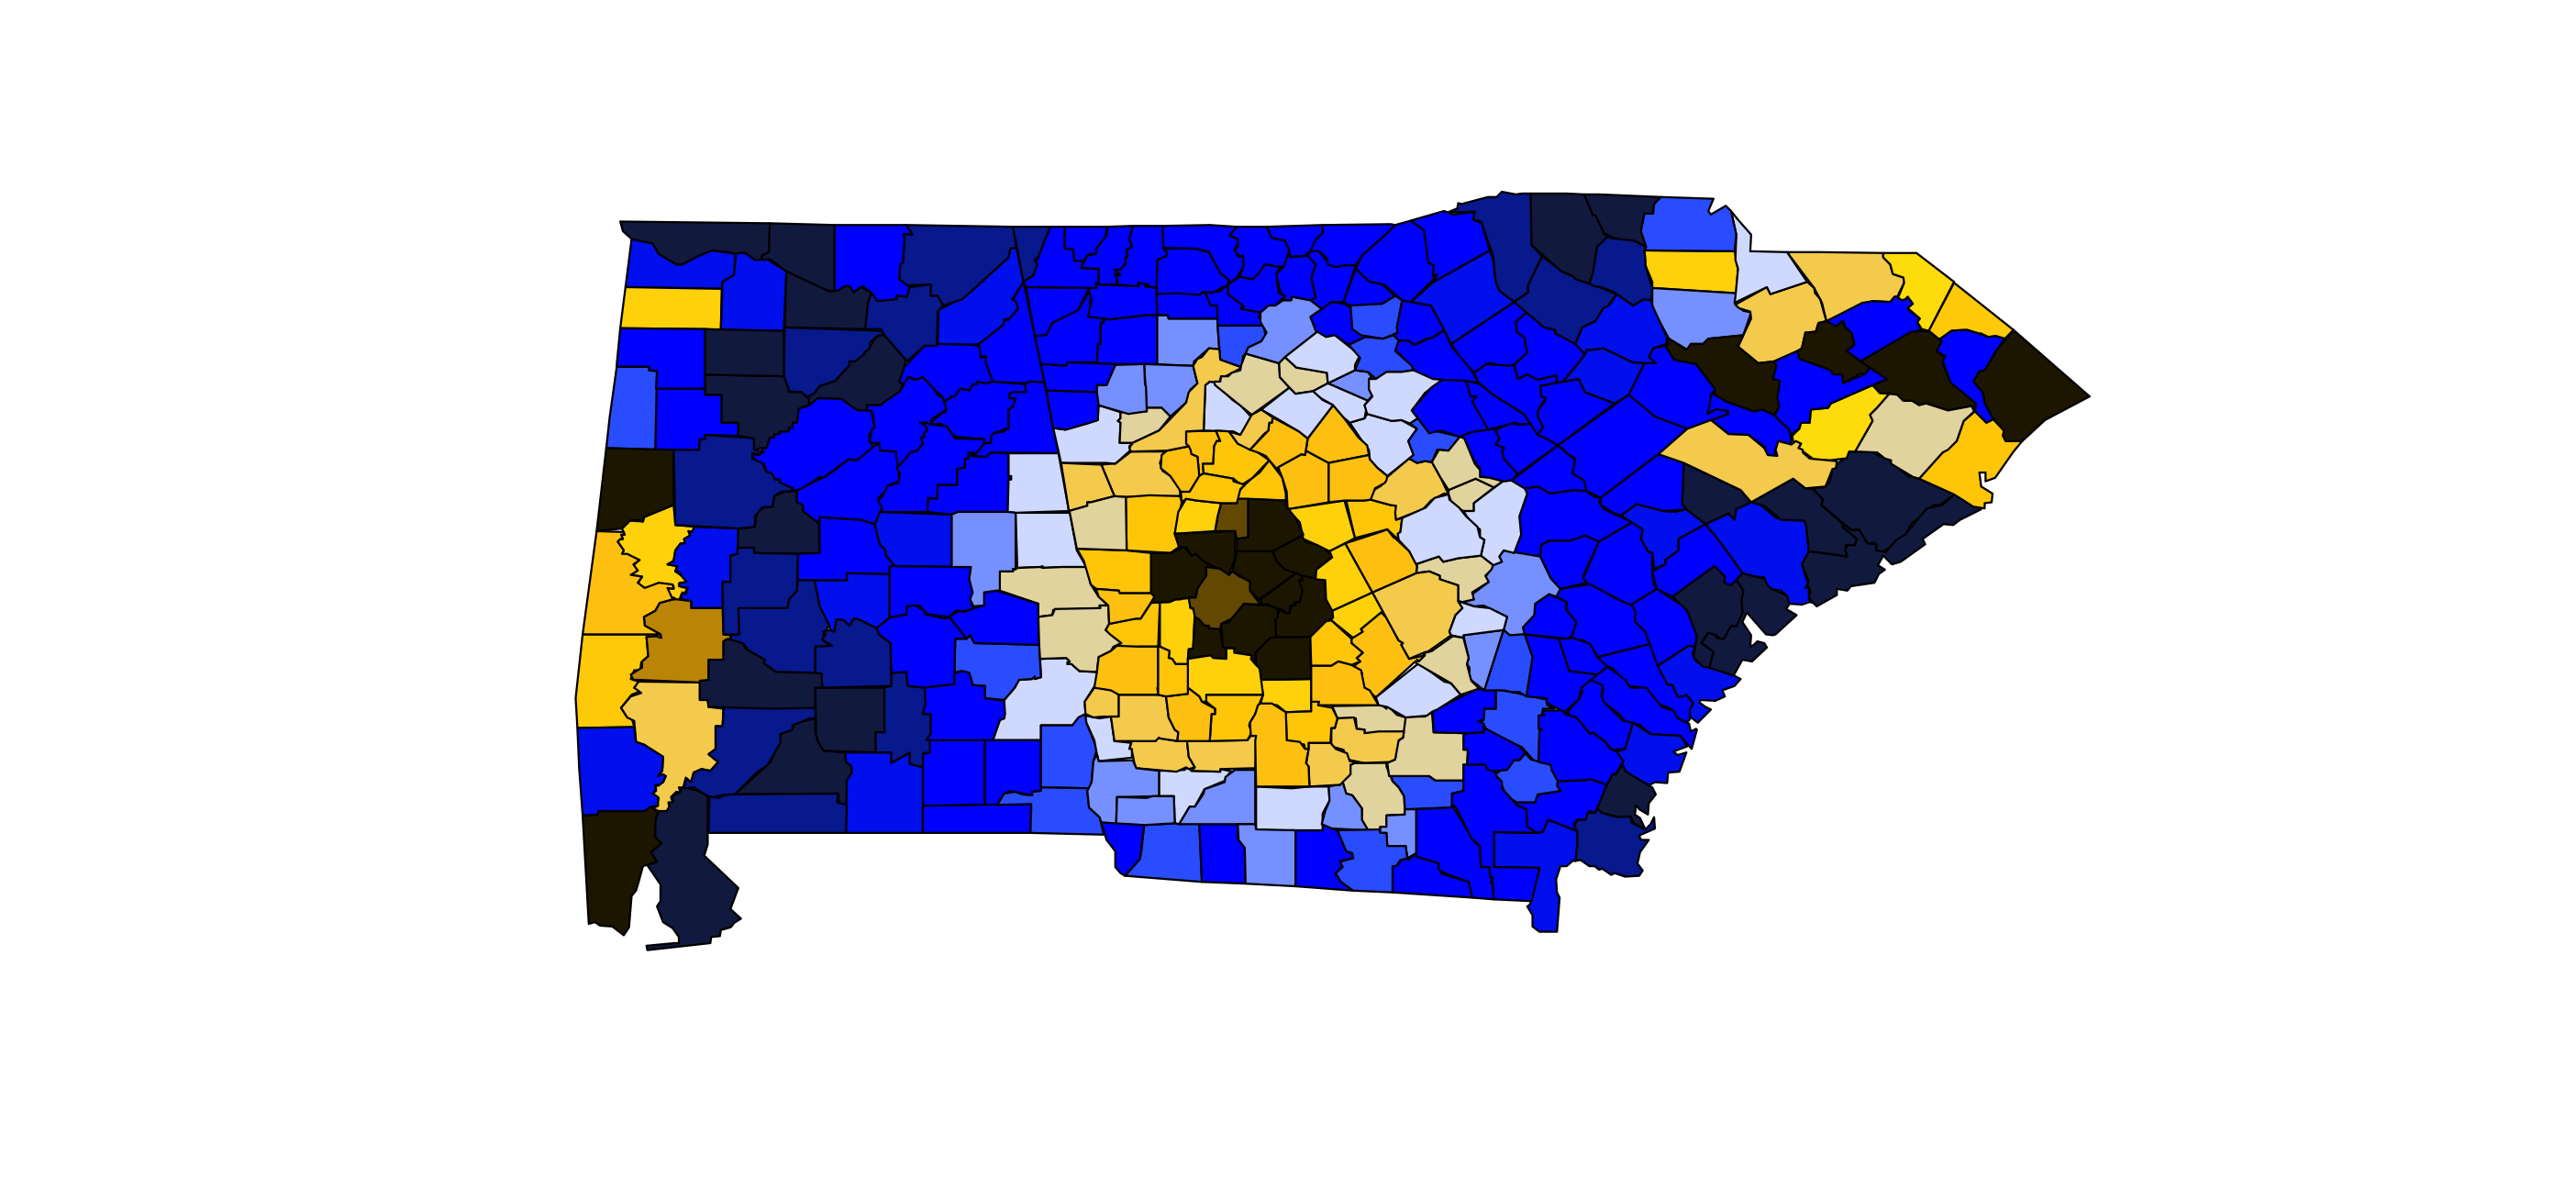
pals::viridis(n = 20) %>% protan() %>% demoplot()